
Basal Body Temperature (BBT) Chart Template: Free Printable and Digital Formats
Monitoring your reproductive health requires precision, and a professional Basal Body Temperature Chart is the ideal tool for tracking subtle thermal shifts. By recording daily readings immediately upon waking, users can accurately identify the ovulation phase within their menstrual cycle. This fertility awareness method helps detect biphasic patterns, which are essential for successful conception or natural family planning. Utilizing a consistent template ensures data clarity for better long-term cycle analysis.
Please check the already made variation of templates below.
Daily BBT Tracking Log
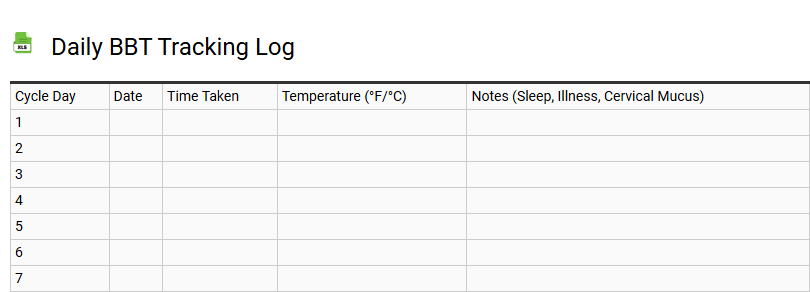
A daily BBT tracking log serves as a fundamental tool for monitoring the menstrual cycle and identifying the fertile window. By recording your waking temperature each morning with a high-precision basal thermometer, you can detect the subtle thermal shift that signals ovulation.
Effective charting provides critical insights into your reproductive health by documenting:
- The transition between the follicular phase and luteal phase.
- The progesterone rise following egg release.
- Consistent patterns for fertility awareness or conception planning.
Utilizing a structured template ensures data accuracy, allowing you to visualize biphasic patterns and pinpoint peak fertility. This systematic approach to fertility tracking empowers individuals to understand their unique hormonal fluctuations and optimize their reproductive journey through precise cycle mapping.
Fertility Awareness Method Chart
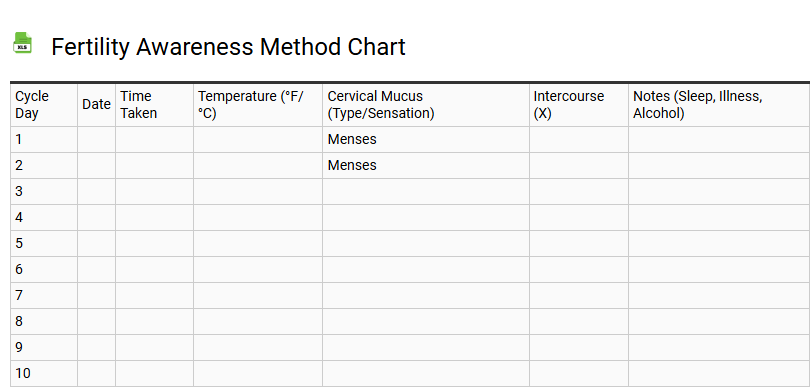
💾 Fertility Awareness Method Chart .xls
A comprehensive Fertility Awareness Method (FAM) chart template serves as a vital diagnostic tool for monitoring reproductive health and identifying the fertile window. By meticulously recording daily Basal Body Temperature (BBT) and changes in cervical mucus, users can accurately track ovulation patterns. This symptothermal approach relies on physiological biomarkers to differentiate between the follicular phase and the luteal phase of the menstrual cycle.
Utilizing a structured template facilitates the identification of peak day and the subsequent thermal shift caused by progesterone. Whether applied for natural family planning or hormonal health assessment, consistent cycle tracking captures crucial data on cycle regularity and potential luteal phase defects. Effective charting empowers individuals to interpret their unique biological rhythms, ensuring precision in both achieving or avoiding pregnancy through evidence-based fertility monitoring and data-driven insights.
Basal Body Temperature Graph Template
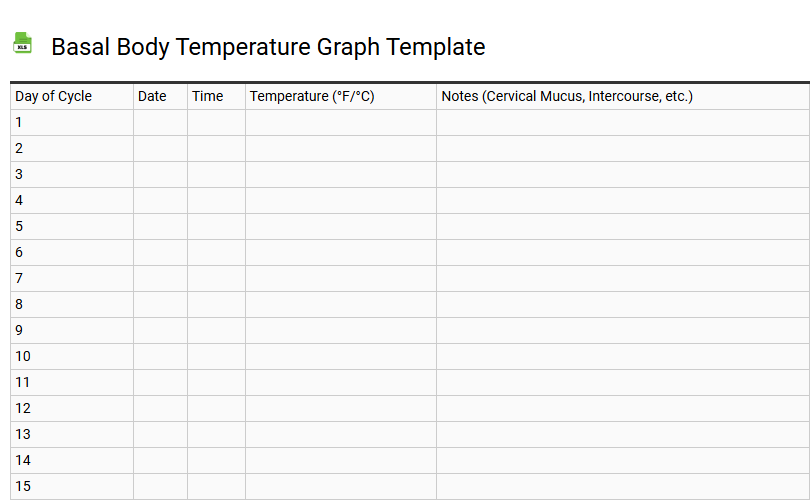
💾 Basal Body Temperature Graph Template .xls
Utilizing a basal body temperature graph template is a fundamental practice for individuals monitoring their reproductive health and ovulation patterns. By recording daily BBT readings with a high-precision digital thermometer, you can effectively map your menstrual cycle. This specialized chart visualizes the follicular phase, the critical thermal shift, and the subsequent luteal phase. Identifying a biphasic pattern is crucial for pinpointing the fertile window, as rising progesterone levels trigger a post-ovulatory temperature spike.
Consistent fertility charting aids in natural family planning and helps detect hormonal fluctuations or irregularities. This template streamlines data entry, making it easier to observe the circadian rhythms and estrogen shifts necessary for conception. Whether tracking for pregnancy planning or cycle awareness, this structured layout ensures accuracy in your fertility journey and reproductive data management.
Ovulation Predictor and BBT Tracker
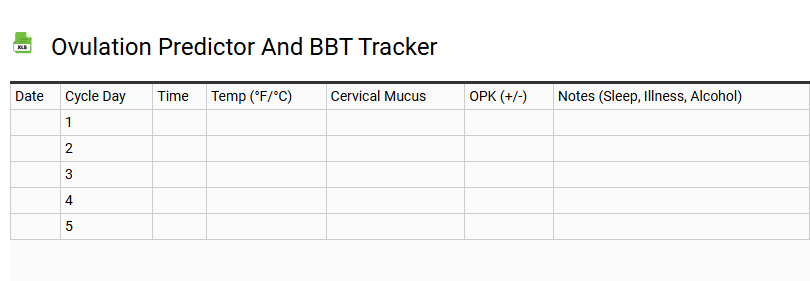
💾 Ovulation Predictor and BBT Tracker .xls
This tracking tool simplifies the process of monitoring your reproductive cycle by combining Basal Body Temperature (BBT) data with Ovulation Predictor Kit (OPK) results. By consistently logging your morning temperature readings, you can identify the subtle thermal shifts that indicate progesterone production following the release of an egg.
Integrating daily hormone test results allows you to anticipate the onset of your fertile window. This dual-method approach provides a clearer picture of your body's natural rhythms, helping you pinpoint peak fertility days with greater precision. Use the structured layout to:
- Log daily temperature fluctuations to confirm ovulation.
- Record LH surge levels for advanced notification of peak fertility.
- Document physical symptoms and cervical mucus changes.
- Visualize cycle trends over several months for improved accuracy.
By maintaining a detailed record, you gain actionable insights into your hormonal health and reproductive timeline.
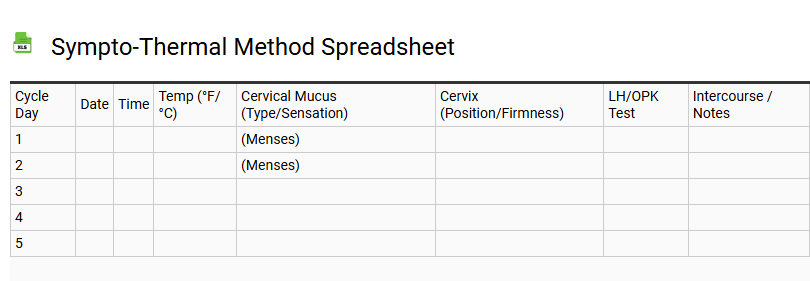
Sympto-Thermal Method Spreadsheet
💾 Sympto-Thermal Method Spreadsheet .xls
This specialized Sympto-Thermal Method spreadsheet serves as a comprehensive digital tool for tracking your menstrual cycle and reproductive health. By integrating daily Basal Body Temperature (BBT) readings with observations of cervical mucus patterns, users can accurately identify their fertile window and confirm ovulation.
Optimized for Fertility Awareness Methods (FAM), the template automates complex calculations essential for precise cycle charting, including:
- Establishing a coverline to detect the post-ovulatory thermal shift.
- Monitoring follicular phase length and luteal phase stability.
- Identifying the peak day for natural family planning (NFP).
- Visualizing hormonal fluctuations through dynamic data mapping.
This data-driven approach empowers individuals to manage contraception or conception goals with precision, providing clear insights into biological markers and fertility rhythms through a streamlined, user-friendly interface.
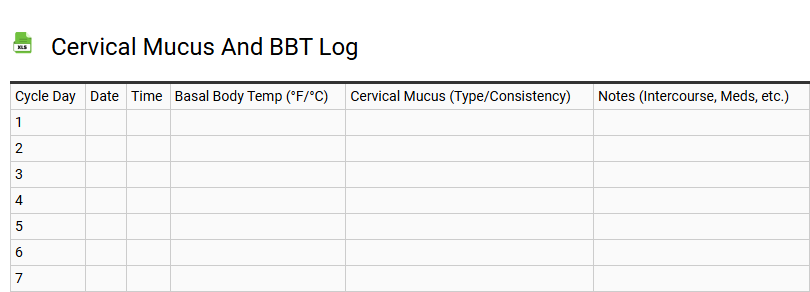
Cervical Mucus and BBT Log
💾 Cervical Mucus and BBT Log .xls
A comprehensive cervical mucus and BBT log serves as a vital tool for tracking the menstrual cycle and identifying the fertile window. By recording daily basal body temperature (BBT) with a precise thermometer, users can detect the thermal shift that confirms ovulation. Simultaneously monitoring cervical fluid consistency-ranging from sticky and creamy to egg white cervical mucus (EWCM)-helps pinpoint the peak day of fertility. This symptothermal method integrates biological markers to provide insights into hormonal health, follicular phase duration, and luteal phase stability. Whether the goal is conception or reproductive monitoring, consistent charting reveals critical patterns in estrogen and progesterone levels. Utilizing a structured template ensures accurate data collection, allowing for precise fertility awareness and a deeper understanding of reproductive health cycles.
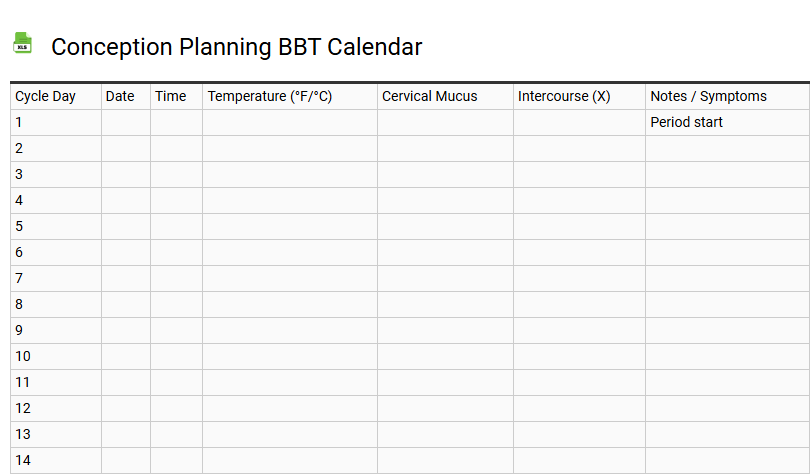
Conception Planning BBT Calendar
💾 Conception Planning BBT Calendar .xls
A Conception Planning BBT Calendar serves as a vital diagnostic tool for monitoring the menstrual cycle and identifying the fertile window. By recording basal body temperature daily using a high-precision thermometer, users can detect the subtle thermal shift triggered by progesterone following ovulation.
- Follicular Phase: Tracks baseline temperatures before the egg is released.
- Biphasic Pattern: Confirms a successful thermal spike, indicating the luteal phase has begun.
- Fertility Awareness: Correlates temperature data with cervical mucus changes to pinpoint peak fertility.
Utilizing this structured template optimizes conception efforts by providing a clear visual representation of reproductive health. Consistent tracking helps identify hormonal imbalances or irregular cycles, ensuring better timing for intercourse during the most viable days of the month.
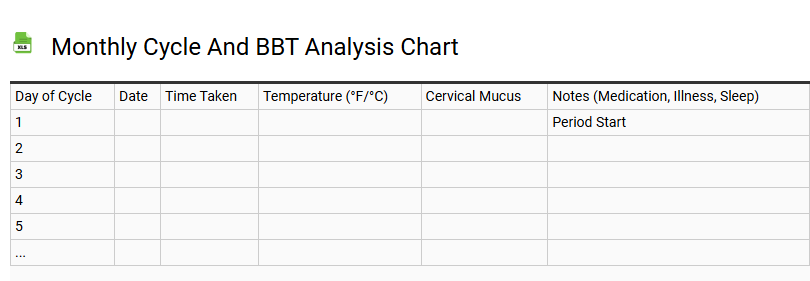
Monthly Cycle and BBT Analysis Chart
💾 Monthly Cycle and BBT Analysis Chart .xls
A monthly cycle and basal body temperature (BBT) analysis chart serves as a precise tool for monitoring reproductive health and identifying hormonal patterns. By recording daily waking temperatures, users can visualize the biphasic shift that typically indicates successful ovulation. This data provides clarity on the follicular and luteal phases, helping to pinpoint the fertile window with accuracy.
An effective tracking template includes several vital metrics for comprehensive analysis:
- Daily Temperature Plots: Precise readings recorded immediately upon waking.
- Cycle Day Tracking: Sequential counting starting from the first day of menstruation.
- Cervical Fluid Observations: Documentation of changes in consistency and volume.
- Physical Indicators: Markers for spotting, mood shifts, or sleep quality.
Consistent documentation allows for the detection of irregularities such as delayed ovulation. This overview empowers individuals to understand their biological rhythms and provides healthcare practitioners with actionable data.
Natural Family Planning Tracker
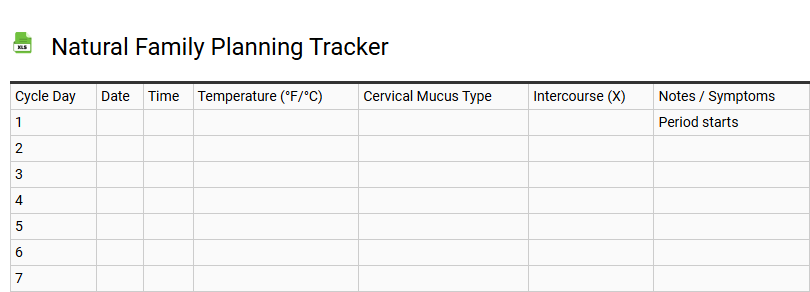
💾 Natural Family Planning Tracker .xls
This Natural Family Planning (NFP) tracker provides a comprehensive framework for precise fertility awareness. By consistently logging basal body temperature (BBT) and cervical mucus consistency, users can accurately pinpoint their fertile window and ovulation day. This template is optimized for the sympto-thermal method, facilitating detailed cycle charting to monitor the follicular phase and luteal phase duration.
- Menstrual cycle mapping for better reproductive health insights.
- Advanced ovulation prediction based on historical biomarkers.
- Integration of hormone monitoring cues and physical symptoms.
Whether your goal is conception or natural contraception, this digital log captures essential hormonal balance indicators. Use this tool to visualize ovulatory patterns, track period regularity, and gain a deeper understanding of your body's biological rhythms through systematic data entry and analysis.
Luteal Phase Defect BBT Monitor
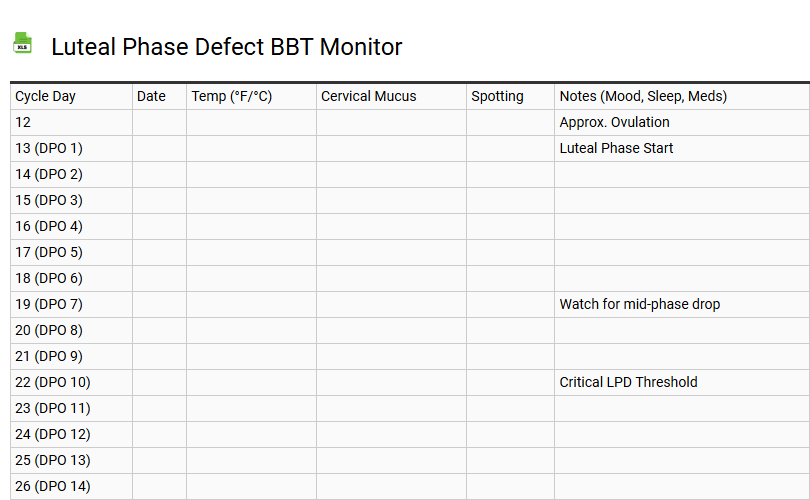
💾 Luteal Phase Defect BBT Monitor .xls
This tracking template for Luteal Phase Defect (LPD) utilizes daily Basal Body Temperature (BBT) data to assess progesterone secretion and corpus luteum health. By recording the post-ovulatory thermal shift, users can identify a short luteal phase-often lasting fewer than ten days-which may compromise the implantation window. High-precision fertility monitoring highlights the biphasic pattern essential for successful conception.
- Ovulation Tracking: Pinpoints the thermal shift following the follicular phase.
- Hormonal Balance: Evaluates progesterone deficiency through sustained high temperatures.
- Cycle Length: Measures the duration from ovulation to the next menstrual cycle onset.
Using this ovulation thermometer log helps detect hormonal imbalances and provides clinicians with diagnostic data regarding reproductive health and endometrial receptivity.
BBT and Hormone Tracking Spreadsheet
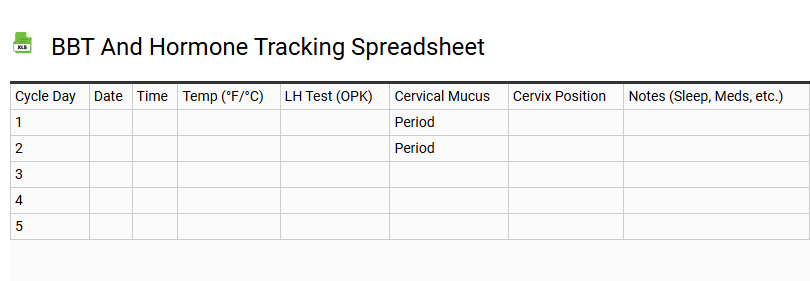
💾 BBT and Hormone Tracking Spreadsheet .xls
This comprehensive BBT and Hormone Tracking Spreadsheet serves as a powerful digital log for monitoring menstrual cycles and identifying the fertile window. By consistently recording Basal Body Temperature, users can visualize the biphasic thermal shift that confirms ovulation.
The template integrates hormone tracking for Luteinizing Hormone (LH) surges and progesterone levels, offering deep insights into follicular phase and luteal phase health. Users can track cervical mucus consistency and ovulation symptoms to enhance fertility awareness.
Designed for natural family planning and conception support, this cycle-charting tool utilizes data visualization to highlight hormonal imbalances. Whether you are cycle syncing or seeking pregnancy, this spreadsheet provides a clear reproductive health overview through precise menstrual health data and predictive analytics.
Daily Temperature Trend Chart
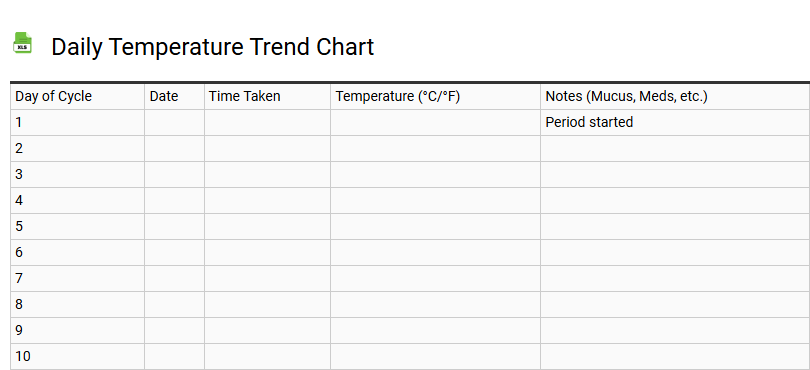
💾 Daily Temperature Trend Chart .xls
A Daily Temperature Trend Chart provides a clear visualization of thermal fluctuations across a 24-hour cycle. This layout typically utilizes a line graph to map temperature variables against specific time intervals, allowing for the immediate identification of peak heat periods and overnight lows.
The structure utilizes a <figure> element to contain the visual data, often rendered via <svg> for clarity at any scale. Accompanying the graphic with a <figcaption> offers essential context, while a descriptive <table> ensures that the raw data points remain accessible to assistive technologies. This configuration is ideal for weather dashboards and climate monitoring tools, offering users a comprehensive overview of environmental shifts through a clean, data-rich interface that prioritizes readability and information hierarchy.
Post-Ovulation BBT Tracker
💾 Post-Ovulation BBT Tracker .xls
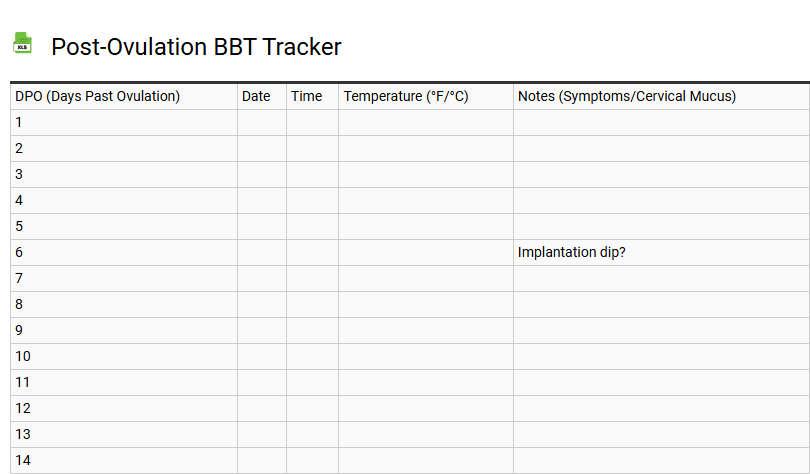
Utilizing a Post-Ovulation BBT Tracker is essential for identifying the luteal phase and confirming successful ovulation. By monitoring your basal body temperature daily with a precise digital thermometer, you can observe the thermal shift triggered by progesterone production from the corpus luteum. A reliable tracker helps visualize the biphasic pattern, where a sustained temperature rise above the established coverline validates your fertile window. This fertility awareness method (FAM) tool is designed to record waking temperature fluctuations, helping users detect a thermal spike or potential pregnancy. Integrating this template into your reproductive health routine ensures accurate menstrual cycle mapping. By documenting these physiological changes, you gain critical insights into your hormonal health, secretory phase duration, and overall fertility tracking accuracy for better cycle management and reproductive wellness.
Fertility Window BBT Log
💾 Fertility Window BBT Log .xls
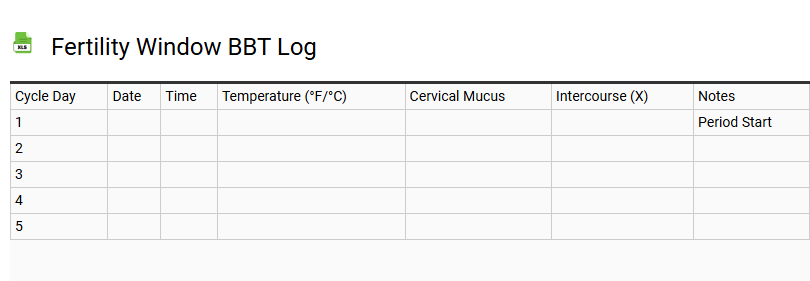
A Fertility Window BBT Log serves as a precise instrument for tracking Basal Body Temperature to identify the onset of ovulation. By recording daily readings with a high-accuracy digital thermometer, users can visualize the thermal shift occurring between the follicular phase and the luteal phase. This systematic charting is essential for natural family planning, allowing for the identification of peak fertility and the conception window.
Integrating cervical mucus observations with menstrual cycle data enhances the predictive accuracy of the log. Consistent monitoring helps detect hormonal fluctuations and ensures better reproductive health awareness. Utilizing a structured template simplifies the process of mapping biphasic patterns, providing couples with actionable insights to optimize timing. This data-driven approach to cycle tracking empowers individuals to understand their biological rhythms and improve their chances of successful pregnancy through ovulation prediction.
Health and Wellness BBT Dashboard
💾 Health and Wellness BBT Dashboard .xls
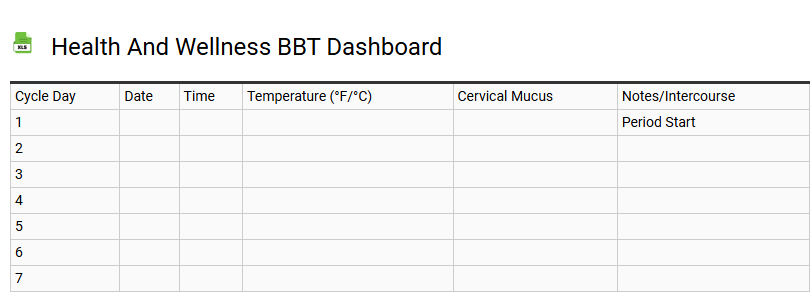
This Health and Wellness BBT Dashboard template provides a sophisticated framework for digital cycle tracking and reproductive health monitoring. By meticulously logging basal body temperature readings, users can visualize critical hormonal shifts occurring between the follicular phase and the luteal phase. The interface is optimized for fertility awareness, utilizing precise data points to identify the ovulation window and confirm peak fertility through thermal shifts.
Integrated with bio-data analysis, this tracking tool simplifies menstrual cycle management by highlighting thermogenesis trends and hormonal balance indicators. The responsive layout ensures seamless digital charting, allowing for real-time trend monitoring of physiological rhythms. Designed for natural family planning and holistic wellness, this template transforms raw temperature data into actionable insights, streamlining metabolic health assessment and reproductive wellness within a centralized, user-friendly ecosystem.
A Basal Body Temperature chart serves as a vital fertility tracking resource for identifying the thermal shift triggered by ovulation. By recording daily fluctuations, you can visualize your menstrual cycle and confirm a healthy biphasic pattern. This template streamlines monitoring your luteal phase and follicular phase, providing essential data for reproductive health. Download our natural family planning tool to gain clarity on your conception window and achieve a deeper understanding of your body's unique hormonal rhythms.