
Body Fat Percentage Comparison Chart Templates and Healthy Ranges
A body fat percentage comparison chart serves as a vital instrument for monitoring physical transformation and body composition. Unlike standard weight metrics, this template distinguishes between lean muscle mass and adipose tissue, providing a clearer picture of overall health. By categorizing fitness levels from essential fat to athletic performance, these visual tools help track metabolic wellness and progress accurately. Utilizing a structured format ensures consistent measurement of your health journey. Please explore our diverse selection of pre-designed body fat percentage comparison chart templates below.
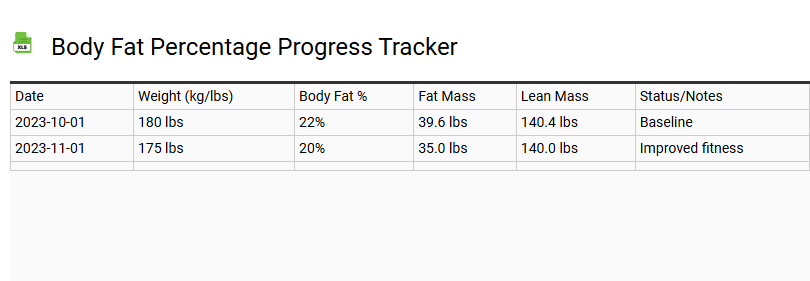
Body Fat Percentage Progress Tracker
💾 Body Fat Percentage Progress Tracker .xls
This comprehensive body fat percentage progress tracker simplifies monitoring your evolving body composition. By documenting routine biometric data, users can effectively visualize the ratio of lean muscle mass to adipose tissue over time. Consistent data entry facilitates precise health metrics analysis, ensuring your fitness transformation stays aligned with specific goals.
Whether utilizing skinfold calipers, bioelectrical impedance, or anthropometric measurements, this digital log manages diverse physiological data points. Tracking these fluctuations is vital for optimizing nutritional intake and hypertrophy programs, moving beyond simple scale weight to understand true physical shifts. Use this template to record weekly trends, calculate body density, and maintain a sustainable caloric deficit while prioritizing muscle preservation. Achieving a leaner physique requires disciplined data management and a long-term assessment of metabolic trends and lipid profiles.
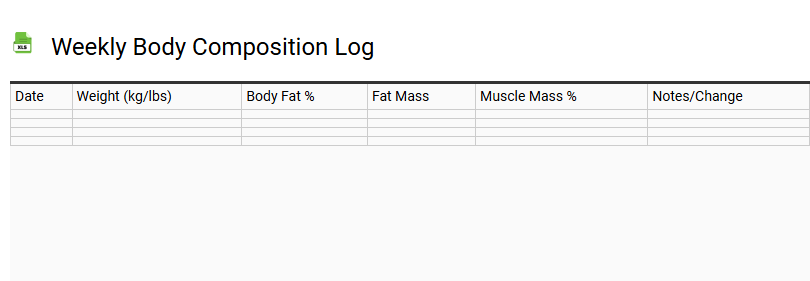
Weekly Body Composition Log
💾 Weekly Body Composition Log .xls
Maintaining a weekly body composition log is essential for tracking your physical transformation and metabolic health beyond simple scale weight. By consistently documenting biometric data, you gain a comprehensive overview of how your diet and exercise routine influence your body fat percentage and lean muscle mass.
This tracking template focuses on key fitness metrics to help you optimize your weight management strategy:
- Skeletal Muscle Mass: Monitor growth and hypertrophy progress.
- Visceral Fat Levels: Assess internal health and chronic disease risk.
- Total Body Water: Track hydration levels and fluid retention.
- Basal Metabolic Rate (BMR): Understand your daily caloric needs.
Utilizing biometric monitoring allows for data-driven adjustments to your fitness journey, ensuring that weight loss stems from fat stores rather than vital skeletal muscle or bone density loss.
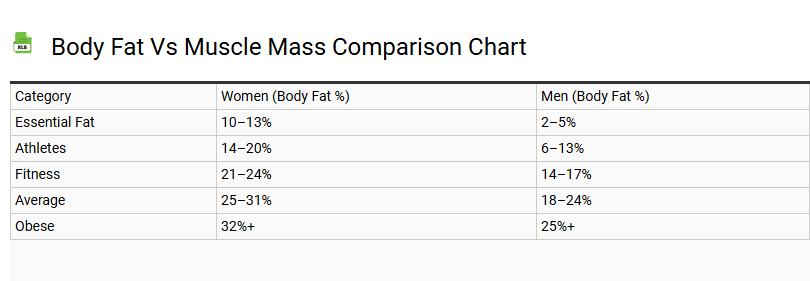
Body Fat vs Muscle Mass Comparison Chart
💾 Body Fat vs Muscle Mass Comparison Chart .xls
A comprehensive body fat vs. muscle mass comparison chart is essential for evaluating body composition beyond basic scale weight. Tracking the relationship between lean muscle tissue and adipose tissue provides a clearer picture of your physique transformation and overall metabolic health. Unlike body mass index (BMI), these metrics distinguish between fat-free mass and subcutaneous fat, allowing for precise fitness tracking.
Increasing muscle density through hypertrophy significantly elevates your basal metabolic rate (BMR), aiding in long-term weight management. Key data points often include:
- Visceral fat levels and associated health risks.
- Skeletal muscle mass gains from resistance training.
- The percentage of essential fat required for hormonal balance.
Utilizing this data facilitates effective body recomposition, ensuring that weight loss originates from fat stores rather than vital structural proteins.
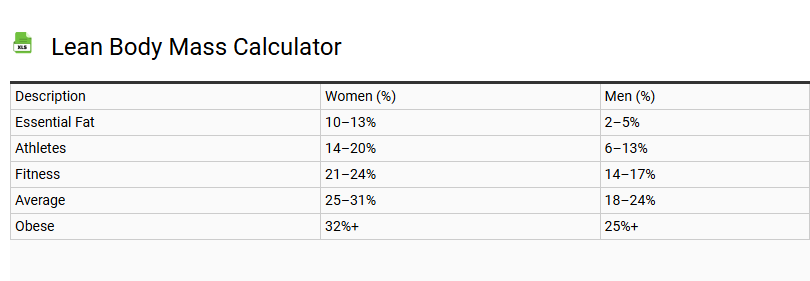
Lean Body Mass Calculator
💾 Lean Body Mass Calculator .xls
Lean Body Mass (LBM) represents the total weight of your body minus all mass derived from fat. This measurement includes vital components such as muscles, bones, organs, connective tissues, and water content. Understanding this value provides a more accurate reflection of physical fitness and metabolic health than looking at total body weight alone.
Tracking your lean weight is essential for several fitness goals:
- Nutritional Planning: Helps determine precise protein requirements to maintain or build muscle.
- Body Composition: Monitors whether weight loss comes from fat stores rather than functional muscle tissue.
- Metabolic Rate: Provides insight into your resting energy expenditure, as muscle tissue burns more calories than fat.
Input your gender, height, and weight into the calculator to receive an estimate based on validated clinical formulas. These results assist in fine-tuning your training intensity and dietary adjustments for optimal physical performance.
Monthly Body Fat Trend Visualizer
💾 Monthly Body Fat Trend Visualizer .xls
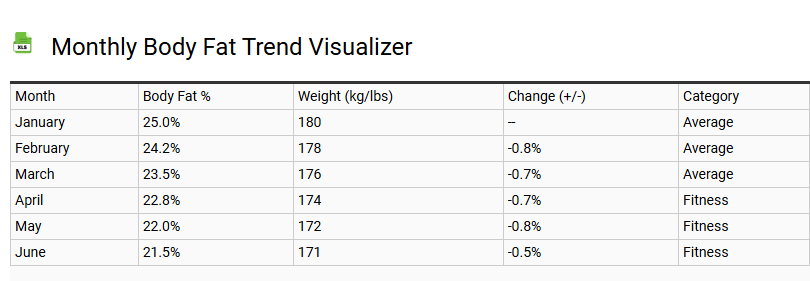
The Monthly Body Fat Trend Visualizer serves as a pivotal analytical tool for monitoring body composition shifts over time. By documenting consistent data points, this template transforms raw biometric data into actionable insights, highlighting the delicate balance between adipose tissue reduction and lean muscle mass retention. Utilizing data visualization helps identify long-term patterns that daily scale fluctuations often mask.
Integrating metrics from bioelectrical impedance scales or skinfold calipers, the visualizer tracks metabolic health progress throughout your fitness journey. This systematic trend analysis allows for precise adjustments in macronutrient distribution and caloric deficits. By observing monthly slopes in fat percentage, users can validate the efficacy of their training protocols and nutritional strategies, ensuring sustainable weight management and optimized physical performance through empirical evidence and visual feedback.
Body Fat Percentage Goal Tracker
💾 Body Fat Percentage Goal Tracker .xls
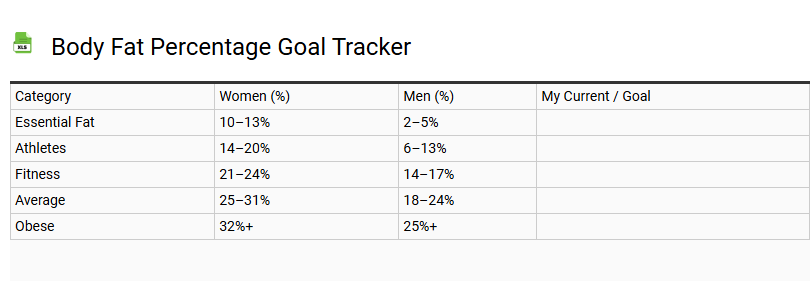
A body fat percentage goal tracker is an essential tool for anyone serious about optimizing their body composition and monitoring fat loss progress. Unlike a traditional scale, this template focuses on the ratio of lean muscle mass to adipose tissue, providing a clearer picture of your overall metabolic health.
- Monitor subcutaneous fat reduction using precise methods like skinfold calipers, bioelectrical impedance, or DEXA scans.
- Visualize fitness milestones and stay motivated while maintaining a caloric deficit.
- Adjust macronutrient intake based on real-time physical transformation data.
By consistently logging anthropometric measurements, users can effectively bridge the gap between their current status and their ideal body weight. This data-driven approach ensures sustainable weight management, improved body mass index (BMI) accuracy, and peak athletic performance.
Skinfold Caliper Measurement Log
💾 Skinfold Caliper Measurement Log .xls
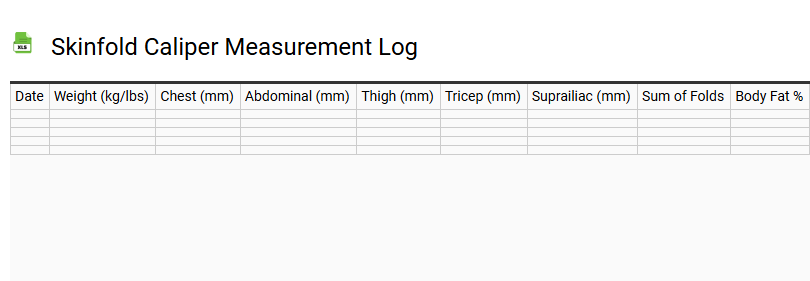
A skinfold caliper measurement log is a vital tool for tracking body composition and monitoring subcutaneous fat fluctuations over time. By recording precise measurements from specific skinfold sites-such as the triceps, suprailiac, abdominal, and thigh-users can calculate an accurate body fat percentage using established anthropometric formulas like the Jackson-Pollock method.
Utilizing a standardized template ensures consistency in data collection, allowing for the evaluation of fat-free mass and overall physical progress. This log should detail the date, site-specific thickness in millimeters, and the average of multiple trials to minimize margin of error. Maintaining a digital or physical record of skinfold thickness facilitates long-term fitness tracking, helping athletes and health enthusiasts validate the efficacy of their nutritional and training interventions through objective body composition analysis.
DEXA Scan Results Comparison Sheet
💾 DEXA Scan Results Comparison Sheet .xls
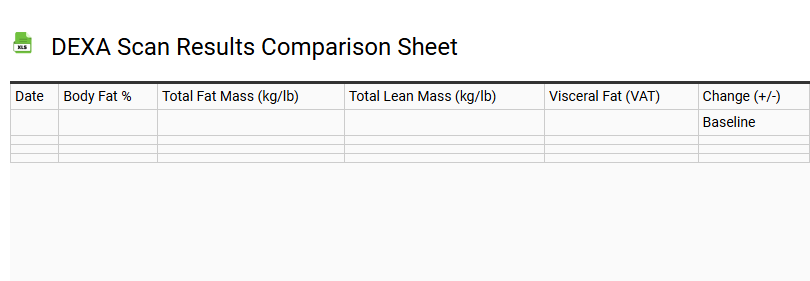
A DEXA scan results comparison sheet serves as a vital longitudinal tracking tool for monitoring bone mineral density (BMD) changes over time. By utilizing dual-energy X-ray absorptiometry technology, this template enables clinicians and patients to evaluate skeletal health through precise measurements of the lumbar spine, hip, and femoral neck. Central to this analysis are the T-score and Z-score, which are critical for diagnosing osteoporosis or osteopenia and assessing overall fracture risk.
Beyond bone health, advanced comparison sheets often integrate body composition data, including lean mass, visceral fat, and body fat percentage. Tracking these metrics in a standardized format allows for the evaluation of metabolic health and the effectiveness of pharmacological or lifestyle interventions. This structured approach ensures data accuracy, helping to visualize physiological trends and optimize long-term wellness strategies.
Bioelectrical Impedance Analysis Tracker
💾 Bioelectrical Impedance Analysis Tracker .xls
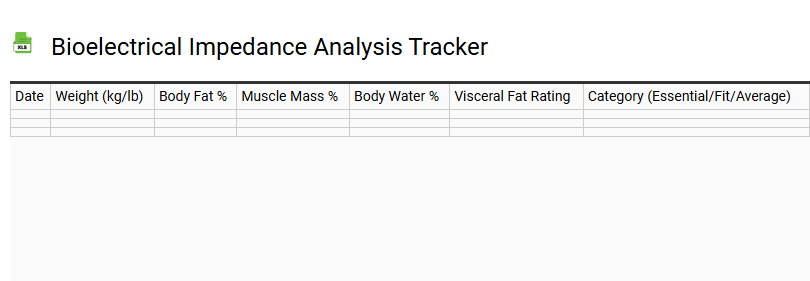
This Bioelectrical Impedance Analysis (BIA) tracker provides a comprehensive framework for monitoring body composition and metabolic health. By measuring electrical conductivity through tissues, users can document critical metrics including body fat percentage, lean muscle mass, and total body water.
The template simplifies recording visceral fat levels, basal metabolic rate (BMR), and phase angle, offering insights into cellular integrity. Designed for fitness monitoring and clinical assessment, it evaluates fluctuations in skeletal muscle and extracellular water beyond standard body mass index (BMI) calculations.
Consistent data entry into this digital log facilitates the analysis of physiological trends, helping to optimize workout recovery and nutritional strategies. Whether utilizing professional-grade sensors or smart impedance scales, this tracker ensures accurate documentation of hydration levels and fat-free mass for long-term wellness management and performance tracking.
Body Fat Category Reference Table
💾 Body Fat Category Reference Table .xls
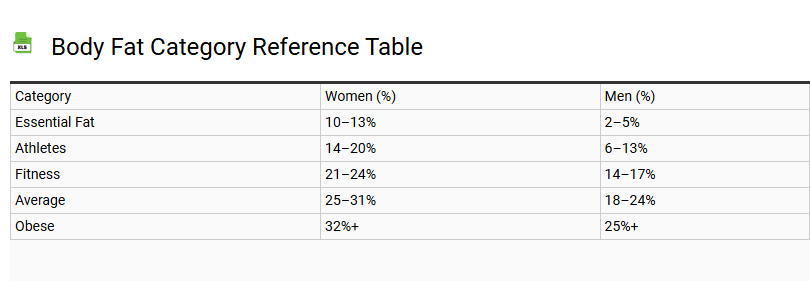
This standardized body fat category reference table serves as a vital framework for assessing individual body composition and overall metabolic health. By categorizing adipose tissue percentages, users can distinguish between essential fat-necessary for physiological function-and storage levels typical of athletes, fitness enthusiasts, or the general population. These health metrics account for biological sex differences, as hormonal requirements necessitate higher lipid stores for women. Utilizing this data allows for precise monitoring of lean mass and body fat distribution. Whether tracking progress via skinfold calipers, bioelectrical impedance, or DEXA scans, these age-adjusted benchmarks help mitigate risks associated with both obesity and insufficient body fat. Implementing this reference ensures objective evaluation of physical conditioning and long-term wellness objectives through scientifically-backed anthropometric data.
Before and After Body Fat Comparison Sheet
💾 Before and After Body Fat Comparison Sheet .xls
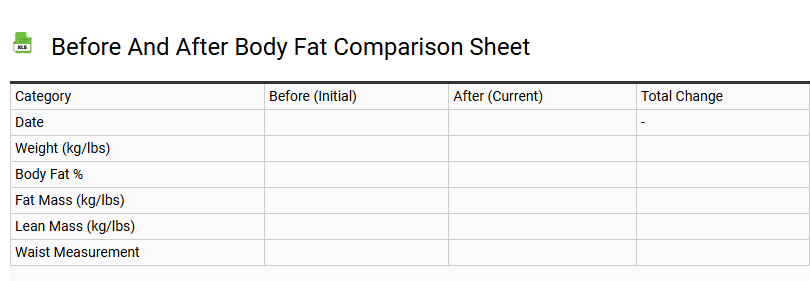
A comprehensive before and after body fat comparison sheet serves as a vital instrument for auditing body composition shifts. This structured template enables individuals to track fluctuations in lean muscle mass versus adipose tissue, providing a data-driven overview of a physical transformation. By recording subcutaneous fat percentages via skinfold calipers or bioelectrical impedance, users can accurately measure their fitness journey progress.
Effective templates prioritize key body metrics, including:
- Waist-to-hip ratio and circumference measurements.
- Total body fat percentage reduction and lean mass retention.
- Visual progress photos for qualitative assessment.
Integrating these data points into a weight loss tracking system enhances metabolic health awareness. This systematic approach to health optimization ensures that nutritional and training adjustments are based on objective body composition analysis rather than just scale weight fluctuations.
Gender-Specific Body Fat Comparison Tool
💾 Gender-Specific Body Fat Comparison Tool .xls
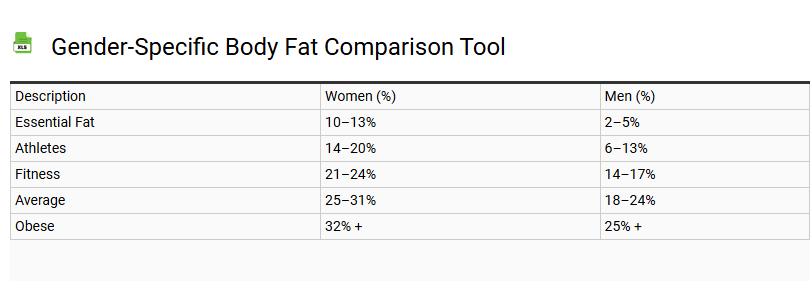
Our Gender-Specific Body Fat Comparison Tool utilizes advanced body composition analysis to evaluate the distinct physiological variances between male and female anatomy. Biological factors dictate that women naturally require higher levels of essential fat for hormonal regulation and reproductive health, typically ranging from 10% to 13%, whereas men function optimally with lower thresholds.
This tool examines adipose tissue distribution, noting how subcutaneous fat and visceral fat accumulate differently across genders. While men often prioritize lean muscle mass development, women's bodies are genetically predisposed to store lipids in specific regions like the hips and thighs. By inputting precise fitness metrics, users gain a comprehensive understanding of their metabolic health. This data-driven approach ensures that your health benchmarks align with biological markers, providing a realistic perspective on physical conditioning, body mass index, and overall wellness targets.
Body Fat Percentage and Waist Circumference Chart
💾 Body Fat Percentage and Waist Circumference Chart .xls
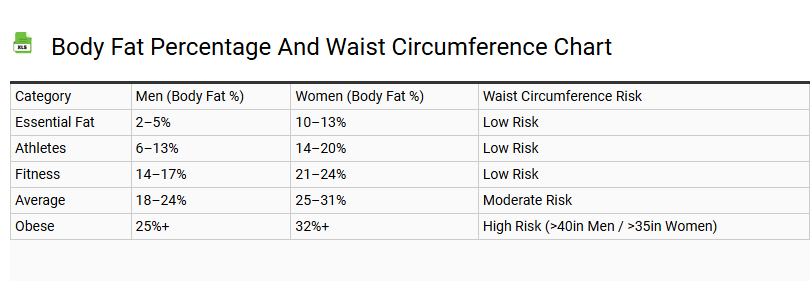
A Body Fat Percentage and Waist Circumference Chart serves as a vital tool for evaluating metabolic health and body composition. Unlike traditional BMI, these metrics distinguish between lean muscle mass and adipose tissue, providing a clearer picture of physical fitness. Tracking waist circumference is particularly crucial for identifying visceral fat levels, which are directly linked to cardiovascular risk and abdominal obesity.
- Subcutaneous fat levels are often measured via skinfold calipers or bioelectrical impedance.
- Maintaining healthy ranges helps mitigate the risk of metabolic syndrome and hypertension.
- Combining girth measurements with total fat percentage offers a superior fitness assessment over weight alone.
By utilizing these benchmarks, individuals can monitor lipid profiles and anthropometric markers. Consistent tracking ensures that weight loss efforts prioritize fat reduction while preserving skeletal muscle for optimal longevity and systemic health.
Ideal Body Weight and Body Fat Calculator
💾 Ideal Body Weight and Body Fat Calculator .xls
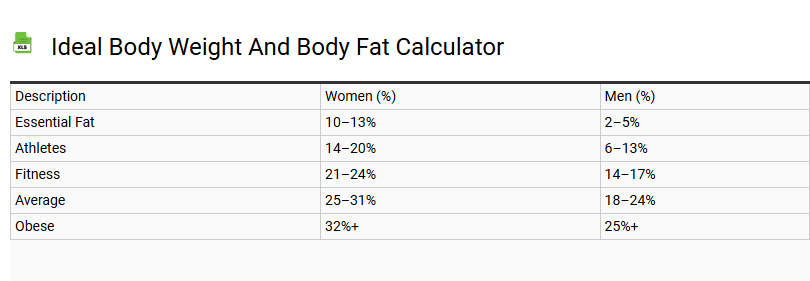
Achieving your fitness goals requires a precise understanding of body composition beyond simple scale weight. This Ideal Body Weight (IBW) and Body Fat Calculator utilizes validated algorithms, such as the Devine and Robinson formulas, to estimate your healthy weight range based on height and gender. By inputting your anthropometric data, you can determine your body fat percentage, which effectively distinguishes lean muscle mass from adipose tissue.
Monitoring these biometric markers is essential for effective weight management and assessing metabolic health. Whether you are tracking BMI (Body Mass Index) or calculating waist-to-hip ratios, this tool provides a comprehensive physique assessment. Understanding your fat-to-muscle ratio helps tailor your caloric intake and exercise routine, ensuring a sustainable lifestyle while targeting specific body recomp objectives for optimal longevity and physical performance.
Body Fat Percentage Variance Tracker
💾 Body Fat Percentage Variance Tracker .xls
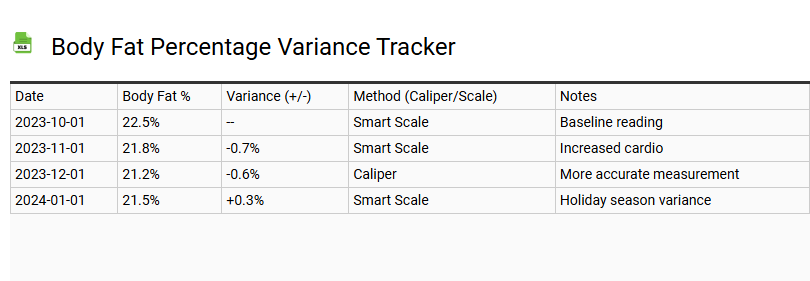
A Body Fat Percentage Variance Tracker is a specialized tool designed to monitor fluctuations in body composition over time. By documenting changes in adipose tissue relative to lean muscle mass, users gain a precise understanding of their metabolic health beyond simple scale weight.
Integrating data from caliper measurements, BIA scales, or DEXA scans allows for the identification of significant trends in fat loss and muscle retention. This systematic variance analysis accounts for daily variables like water retention and glycogen levels, ensuring that weight management strategies remain evidence-based. Utilizing a tracker helps optimize macronutrient intake and exercise intensity by highlighting how the body responds to specific physiological stressors. Consistent progress monitoring through these metrics is essential for anyone seeking sustainable improvements in physical conditioning and body fat distribution.
This body fat percentage comparison chart template serves as a vital tool for tracking body composition and distinguishing between lean mass and adipose tissue. By utilizing this standardized visual reference, users can accurately categorize fitness levels against established biometric data.
Implementing this resource facilitates consistent health monitoring and anthropometric assessment. Use these insights to refine your wellness journey, ensuring progress aligns with healthy, gender-specific body fat ranges for optimal longevity and physical performance.