
Body Recomposition Progress Chart Template
Achieving successful body recomposition requires precise monitoring of simultaneous fat loss and muscle hypertrophy. Utilizing a dedicated progress chart allows fitness enthusiasts to log essential biometric data, including body fat percentage, caloric intake, and lean tissue growth. This systematic approach transforms raw metrics into actionable insights, helping you balance resistance training with optimal nutrition for a complete physique overhaul. Stay accountable by documenting your transformation through consistent data analysis. Please explore our diverse range of pre-made variation of templates below.
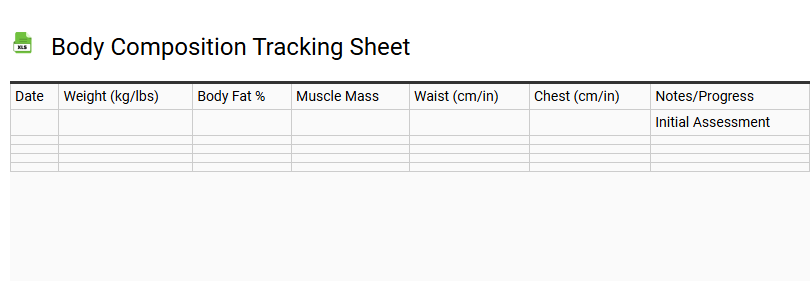
Body Composition Tracking Sheet
💾 Body Composition Tracking Sheet .xls
A comprehensive body composition tracking sheet serves as a vital instrument for monitoring physiological changes beyond basic weight measurements. By utilizing this template, individuals can systematically document body fat percentage, lean muscle mass, and basal metabolic rate (BMR) to gauge true fitness progress. Integrating biometric data such as waist-to-hip ratio, visceral fat levels, and subcutaneous fat thickness provides a holistic view of metabolic health. This structured log facilitates the recording of results from skinfold calipers or bioelectrical impedance analysis, helping to refine macronutrient distribution and caloric targets. Tracking these metrics alongside Body Mass Index (BMI) and skeletal muscle growth ensures data-driven adjustments to exercise regimens. Consistent entry into a dedicated tracking tool empowers users to visualize trends in fat-free mass and overall physique transformation, fostering long-term adherence to health and wellness objectives.
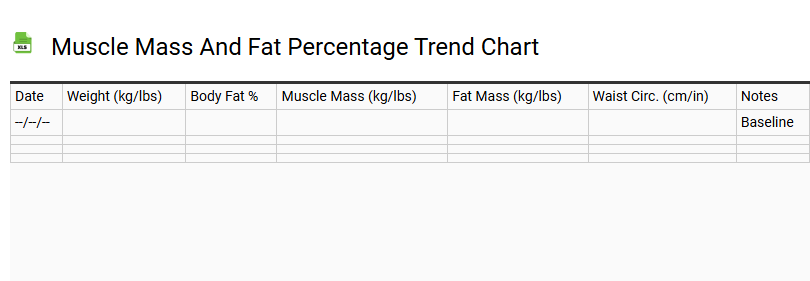
Muscle Mass and Fat Percentage Trend Chart
💾 Muscle Mass and Fat Percentage Trend Chart .xls
This biometric data visualization template provides a comprehensive framework for monitoring body composition shifts. By utilizing longitudinal tracking, users can analyze the inverse correlation between skeletal muscle mass and adipose tissue levels. This analytical tool is essential for evaluating body recomposition, ensuring that fitness protocols effectively stimulate lean mass hypertrophy while optimizing lipid metabolism.
The integrated chart facilitates data-driven health insights by plotting monthly subcutaneous fat percentages against total lean body mass. Key benefits include:
- Precise correlation between nutritional intake and protein synthesis.
- Visualizing trends in metabolic rate and physical transformation.
- Metric-based adjustments for resistance training and fat oxidation goals.
Leveraging this fitness tracking dashboard ensures consistent progress monitoring, helping athletes and health enthusiasts maintain peak physiological performance through accurate biometric analytics.
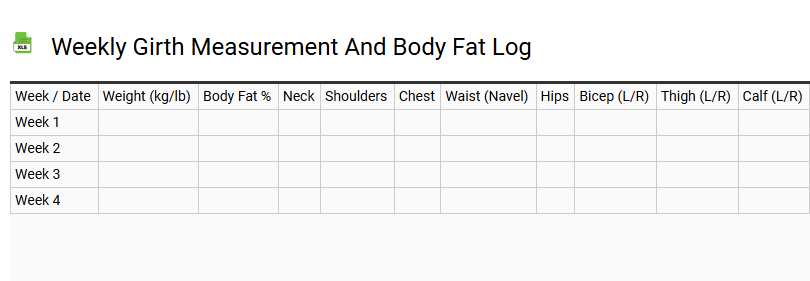
Weekly Girth Measurement and Body Fat Log
💾 Weekly Girth Measurement and Body Fat Log .xls
This Weekly Girth Measurement and Body Fat Log is an essential tool for tracking body composition and monitoring physique transformation. By consistently recording anthropometric data, individuals can evaluate muscle mass retention and subcutaneous fat loss more accurately than by using a scale alone.
The template captures vital metrics using a tape measure for circumference sites-including the waist, hips, chest, and limbs-alongside body fat percentage readings from calipers or bioelectrical impedance. Monitoring these variables helps calculate the waist-to-hip ratio, a critical marker for metabolic health.
Regularly documenting these progress tracking stats allows for data-driven adjustments to hypertrophy training or fat loss nutrition plans. Maintaining this log ensures consistency in your fitness journey, providing the quantitative feedback necessary to optimize long-term health markers and athletic performance.
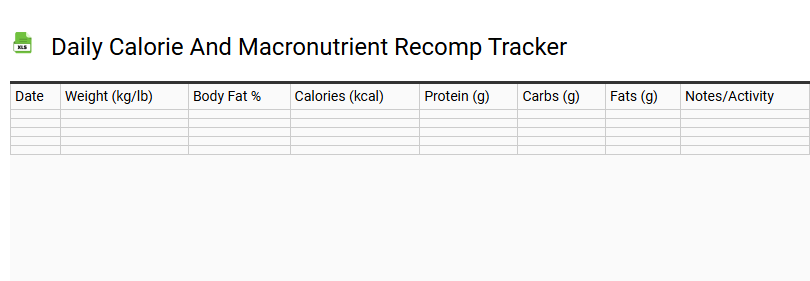
Daily Calorie and Macronutrient Recomp Tracker
💾 Daily Calorie and Macronutrient Recomp Tracker .xls
A Daily Calorie and Macronutrient Recomp Tracker serves as a vital tool for balancing energy intake with physical performance. This resource allows users to record their protein, carbohydrate, and fat consumption to facilitate simultaneous muscle gain and fat loss.
Using this template ensures precision in your nutritional approach by offering:
- Caloric Monitoring: Stay within specific ranges to promote metabolic efficiency while maintaining lean mass.
- Macro Distribution: Fine-tune ratios to support recovery, hormonal health, and sustained energy levels.
- Data-Driven Adjustments: Identify trends over time to make informed changes to your dietary plan.
By consistently documenting nutritional data, you gain the clarity needed to reach your fitness milestones. Precise logging ensures that every meal serves a specific purpose in your body transformation journey, turning daily habits into measurable results.
Body Recomposition Progress Dashboard
💾 Body Recomposition Progress Dashboard .xls
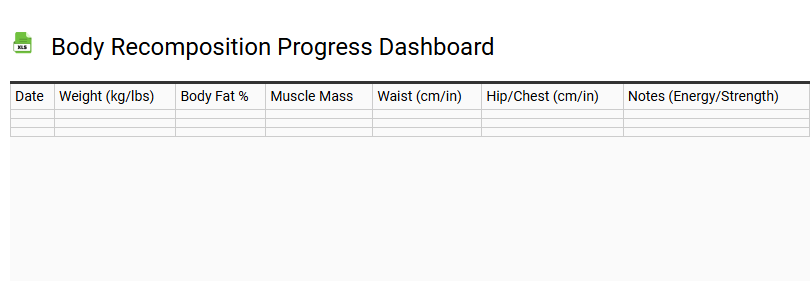
A Body Recomposition Progress Dashboard serves as a centralized hub for tracking simultaneous fat loss and muscle gain. Unlike traditional weight-loss trackers, this layout prioritizes specific data points that reflect changes in body texture and shape rather than just total mass.
- Body Composition Metrics: Track lean body mass, body fat percentage, and skeletal muscle mass to visualize internal physical transformations.
- Anthropometric Data: Log measurements for the waist, chest, and limbs to identify fat loss in areas where the scale may remain stagnant.
- Performance Indicators: Monitor strength plateaus and personal records to ensure caloric intake supports muscle preservation.
- Visual Documentation: Dedicated areas for progress photos provide objective evidence of muscle definition improvements.
Using this template ensures a comprehensive view of metabolic health, helping users stay motivated when the scale does not move but their physique improves.
Lean Body Mass vs. Fat Mass Tracker
💾 Lean Body Mass vs. Fat Mass Tracker .xls
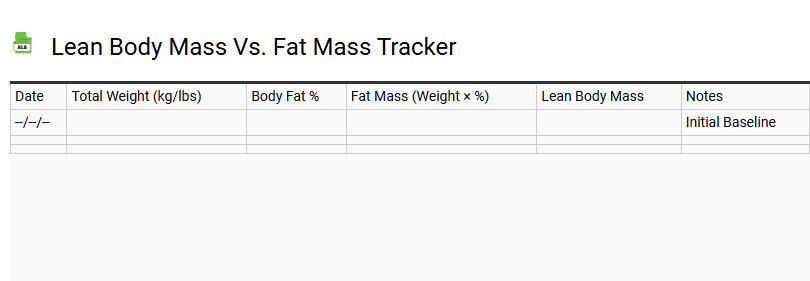
Utilize this body composition tracker to distinguish between skeletal muscle mass and adipose tissue accumulation. Unlike standard scales, monitoring lean body mass versus fat mass provides a granular view of your physiological transformation. By recording data from skinfold measurements, bioelectrical impedance, or DEXA scans, you can accurately calculate your body fat percentage and evaluate the efficacy of your current nutritional programming.
This template is essential for weight management and hypertrophy goals, ensuring that a caloric deficit targets lipids while preserving functional tissue. Tracking these health metrics helps optimize your basal metabolic rate and refine fitness tracking strategies. Whether you are focused on performance optimization or long-term wellness, understanding the ratio of lean tissue to body fat is the ultimate key to sustainable physical progress and metabolic health.
Weight and Body Fat Percentage Comparison Tool
💾 Weight and Body Fat Percentage Comparison Tool .xls
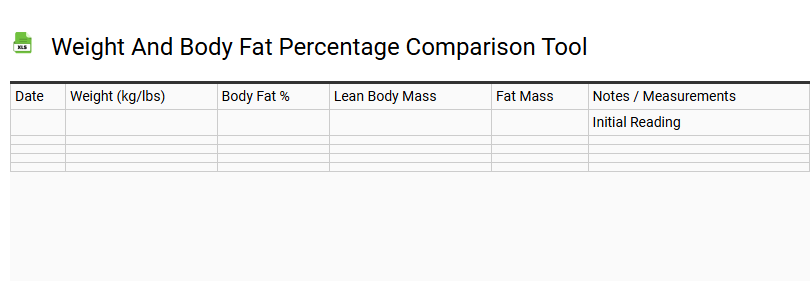
This specialized weight and body fat percentage comparison tool provides a comprehensive analysis of your body composition beyond simple scale weight. By evaluating the ratio of lean muscle mass to adipose tissue, users gain deeper insights into their metabolic health and physical fitness levels. Unlike traditional BMI calculators, this comparison resource highlights changes in body density and fat-free mass, offering a more accurate reflection of body transformation progress.
Whether you are tracking weight loss or hypertrophy, monitoring these dual metrics ensures a balanced approach to wellness. Use this interface to log historical data, visualize trends in visceral fat reduction, and refine your nutritional strategy. Understanding your unique body makeup is essential for optimizing athletic performance and long-term vitality. By comparing these critical health markers, you transition from tracking mere pounds to mastering your overall physiological profile.
Bi-Weekly Body Measurement Progress Chart
💾 Bi-Weekly Body Measurement Progress Chart .xls
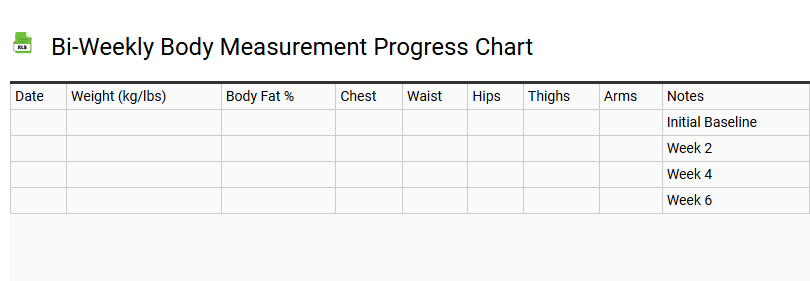
A bi-weekly body measurement progress chart is an essential tool for objective fitness tracking and body composition analysis. By documenting anthropometric data every fourteen days, individuals can accurately monitor their physical transformation beyond simple scale weight. This systematic progress log captures vital metrics that validate fat loss and muscle hypertrophy trends.
To ensure a comprehensive biometric overview, include the following key data points:
- Waist circumference and hip width to monitor core changes.
- Bicep diameter and chest girth for upper body muscle gain.
- Thigh and calf measurements to evaluate lower body development.
- Body fat percentage estimations for a deeper physique assessment.
Maintaining a consistent tracking frequency mitigates the influence of daily water fluctuations. Utilizing this fitness data empowers users to refine nutrition plans and strength training routines for optimal long-term results.
Progress Photo and Metric Integration Log
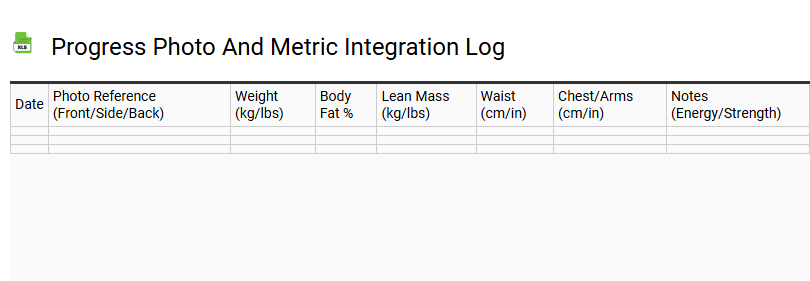
💾 Progress Photo and Metric Integration Log .xls
A Progress Photo and Metric Integration Log serves as a comprehensive tool for physique transformation tracking. By synchronizing biometric data with visual documentation, users gain a multidimensional view of their fitness journey. This template facilitates the recording of body composition variables, such as body fat percentage and circumference measurements, alongside high-resolution imagery for objective visual assessment.
Utilizing this data-driven approach offers several advantages:
- Side-by-side comparisons to identify subtle physiological changes.
- Correlation between caloric intake and muscle hypertrophy or fat loss.
- Enhanced accountability through longitudinal data analysis.
- Validation of non-scale victories that body weight alone cannot capture.
Integrating performance metrics with aesthetic logs ensures a holistic wellness strategy, allowing for precise adjustments to nutrition and training protocols based on empirical evidence and visual milestones.
Target Weight and Body Fat Percentage Planner
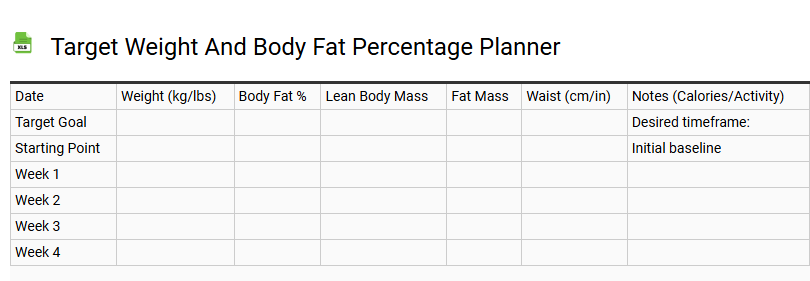
💾 Target Weight and Body Fat Percentage Planner .xls
Achieving a balanced body composition requires a structured roadmap. This Target Weight and Body Fat Percentage Planner serves as a dedicated tool for tracking physical transformations. By inputting current metrics alongside desired outcomes, users can visualize the specific path toward their ideal physique.
This resource focuses on two critical data points for long-term health:
- Target Weight: The specific mass goal adjusted for individual health and performance needs.
- Body Fat Percentage: The proportion of adipose tissue relative to total lean mass, ensuring fat loss rather than muscle depletion.
Utilizing this template ensures that progress remains measurable and realistic. It helps distinguish between simple scale fluctuations and genuine body composition changes. By monitoring these variables consistently, individuals can make informed adjustments to their nutrition and exercise routines to maintain functional strength and overall wellness.
Strength Progress and Body Metric Correlation Chart
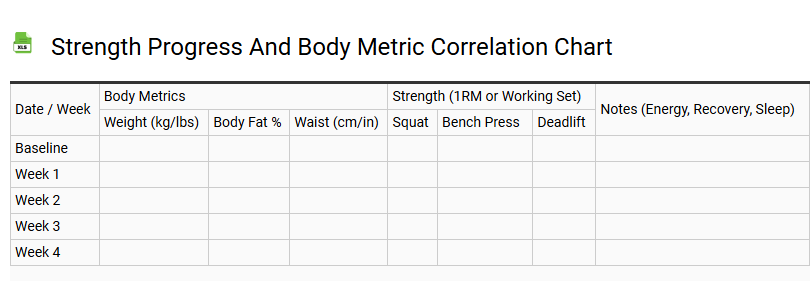
💾 Strength Progress and Body Metric Correlation Chart .xls
This tracking template facilitates a sophisticated analysis of the synergy between hypertrophy and neuromuscular adaptation. By mapping compound lift benchmarks against fluctuating body composition data, athletes can visualize how lean muscle mass gains correlate with 1RM (one-rep max) improvements. This data-driven approach monitors progressive overload across various training cycles, identifying the precise relationship between body fat percentage and absolute strength output.
Integrating anthropometric measurements with volume and intensity metrics allows for a comprehensive overview of metabolic efficiency and recovery. Utilizing this correlation chart helps refine caloric intake strategies, ensuring that strength gains are optimized relative to total body weight. Tracking these variables concurrently provides the necessary insights to adjust periodization models, ensuring consistent performance peaks and sustainable physical transformation through evidence-based performance tracking.
Monthly Body Recomposition Summary Report
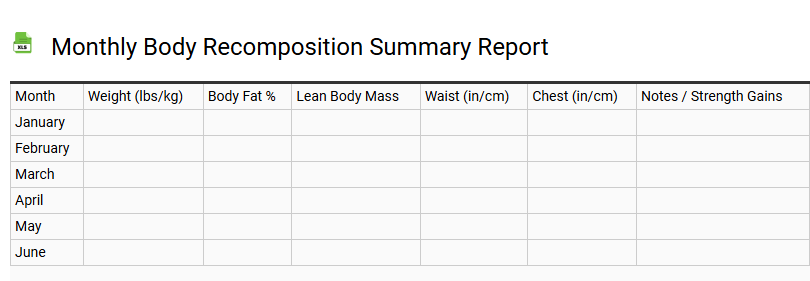
💾 Monthly Body Recomposition Summary Report .xls
This Monthly Body Recomposition Summary Report serves as a data-driven tool to monitor your physiological transformation. By analyzing the synergy between lean muscle mass accretion and adipose tissue reduction, this template tracks your body fat percentage fluctuations with precision. Incorporating anthropometric data, such as skinfold measurements and girth circumferences, ensures a holistic view of your physical conditioning beyond the scale. Evaluate your macronutrient ratios and caloric deficit or surplus to optimize metabolic rate and protein synthesis. By documenting progressive overload in your resistance training logs and correlating it with basal metabolic rate (BMR) trends, you can refine your hypertrophy goals. This structured overview facilitates informed adjustments to your nutritional strategy and energy expenditure, ensuring sustainable fat loss and improved body composition markers every thirty days.
Basal Metabolic Rate and TDEE Progress Tracker
💾 Basal Metabolic Rate and TDEE Progress Tracker .xls
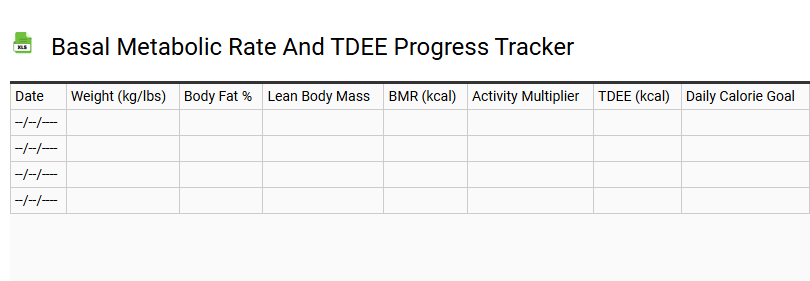
Achieving sustainable body composition goals requires a precise understanding of energy balance. This Basal Metabolic Rate (BMR) and Total Daily Energy Expenditure (TDEE) progress tracker serves as a comprehensive tool for monitoring your metabolic health. By calculating your resting energy expenditure and factoring in your physical activity level (PAL), the template establishes an accurate baseline for your maintenance calories.
Monitoring these metrics allows for data-driven adjustments to your daily caloric intake, whether your objective is a caloric deficit for fat loss or a caloric surplus for muscle hypertrophy. The tracker accounts for variables such as the thermic effect of food (TEF) and non-exercise activity thermogenesis (NEAT). Consistent logging empowers you to optimize your metabolic rate, ensuring long-term weight management success and physiological efficiency through actionable biometric data and activity multipliers.
Skinfold Caliper Measurement Log
💾 Skinfold Caliper Measurement Log .xls
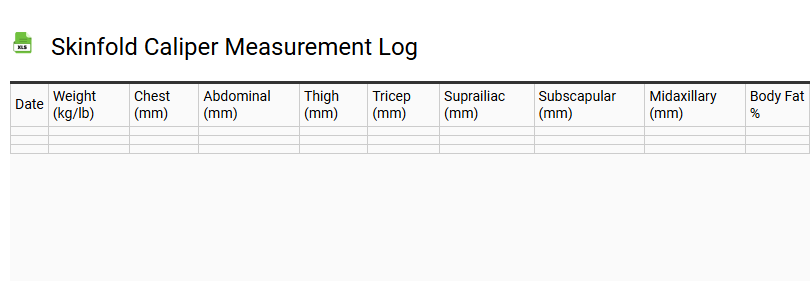
A professional skinfold caliper measurement log serves as a precise anthropometric assessment tool for monitoring body composition changes. By recording subcutaneous fat thickness at standardized anatomical sites-including the triceps, suprailiac, abdominal, and thigh-users can calculate an accurate body fat percentage. This log facilitates the application of the Jackson-Pollock formula, ensuring data consistency across multiple testing sessions. Utilizing calipers for regular pinch tests allows for the tracking of fat-free mass and metabolic health progress. Maintaining a detailed measurement log minimizes technical error and enhances data reliability. Whether conducting a 3-site or 7-site skin fold analysis, this template provides a structured format to document millimeter readings, enabling athletes and clinicians to visualize fitness trends and adjust nutritional strategies based on objective physiological evidence and body density metrics.
Waist-to-Hip Ratio Progress Chart
💾 Waist-to-Hip Ratio Progress Chart .xls
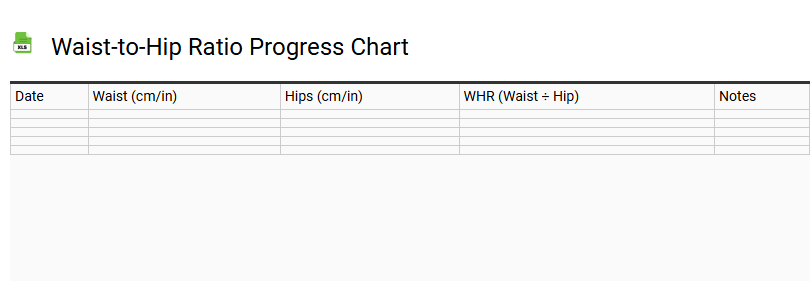
A Waist-to-Hip Ratio (WHR) Progress Chart is an essential tool for tracking body fat distribution and evaluating metabolic health. By consistently logging measurements of the narrowest part of the waistline against the widest point of the hips, individuals can monitor shifts in abdominal obesity. This template facilitates data-driven insights into cardiovascular health and chronic disease prevention, as a lower ratio typically indicates reduced visceral fat levels.
Utilizing a structured tracker allows for:
- Precise circumference measurements using a flexible tape.
- Identification of apple-shaped versus pear-shaped body types.
- Visualizing weight loss trends and fitness milestones.
- Assessing risks related to type 2 diabetes and hypertension.
Maintaining a dedicated WHR log empowers users to achieve optimal body composition and long-term wellness goals through consistent biometric monitoring.
A comprehensive body recomposition progress chart serves as a vital instrument for monitoring simultaneous muscle hypertrophy and subcutaneous fat loss. This template tracks essential metrics such as body fat percentage, lean mass, and waist circumference, offering a clearer picture than scale weight alone. By analyzing caloric intake alongside strength performance, you can optimize your metabolic rate for peak efficiency. Consistently logging these physiological variables ensures data-driven adjustments. Utilize this structured framework to visualize your transformation, maintain a sustainable deficit, and achieve a muscular physique.