
Clinical Blood Pressure Summary Report Template
Managing hypertension effectively requires precise data tracking and consistent documentation. A professional clinical blood pressure summary report serves as an essential tool for monitoring cardiovascular health trends over time. By utilizing a structured template, healthcare providers can systematically record systolic and diastolic measurements, ensuring diagnostic accuracy during routine check-ups. These standardized medical records facilitate comprehensive clinical assessments and informed treatment adjustments for improved patient outcomes. Please explore our selection of professionally designed template variations below to find the ideal fit for your clinical practice.
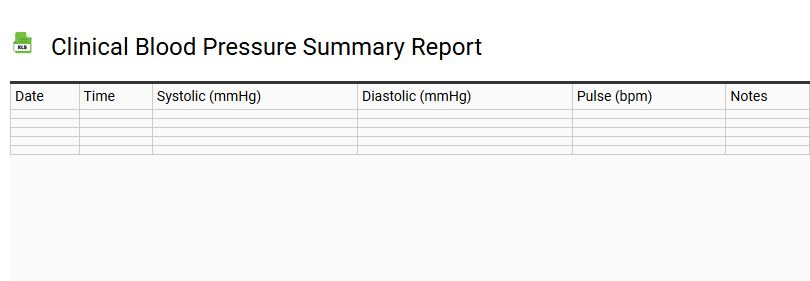
Clinical Blood Pressure Summary Report
💾 Clinical Blood Pressure Summary Report .xls
A Clinical Blood Pressure Summary Report serves as a structured overview of a patient's cardiovascular metrics over a defined observation period. This document prioritizes clarity by organizing essential data points to assist healthcare providers in evaluating heart health and circulatory stability.
The report typically incorporates the following elements:
- Average Readings: Calculated systolic and diastolic values to determine overall pressure trends.
- Heart Rate Variance: Documentation of pulse consistency during various activity levels.
- Temporal Data: Timestamps for morning and evening measurements to identify nocturnal patterns.
- Clinical Annotations: Contextual notes regarding medication adherence or physiological stressors.
By consolidating these metrics, the template facilitates rapid assessment of hypertension risks and treatment efficacy. It ensures that medical teams have access to a concise history, enabling data-driven decisions for long-term patient wellness and intervention strategies.
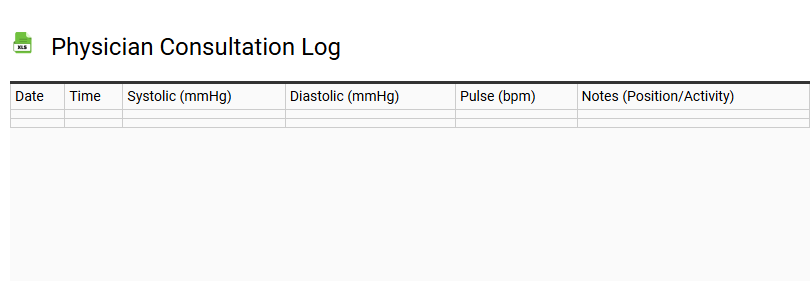
Physician Consultation Log
💾 Physician Consultation Log .xls
A physician consultation log serves as a vital clinical documentation tool for tracking patient encounters and ensuring continuity of care. This structured template facilitates the organized recording of medical history, vital signs, and diagnostic assessments. By utilizing a standardized format, healthcare professionals can efficiently document SOAP notes, treatment plans, and ICD-10 billing codes.
Key components of an effective log include:
- Patient Demographics: Essential for accurate medical records and identification.
- Clinical Findings: Detailed notes on physical examinations and presenting symptoms.
- Intervention Strategies: Prescribed medications, laboratory orders, and follow-up protocols.
Maintaining a comprehensive consultation summary ensures HIPAA compliance and streamlines practice management. These logs act as a primary reference for insurance reimbursement and long-term patient health monitoring, enhancing the overall quality of physician-patient interactions within an integrated healthcare system.
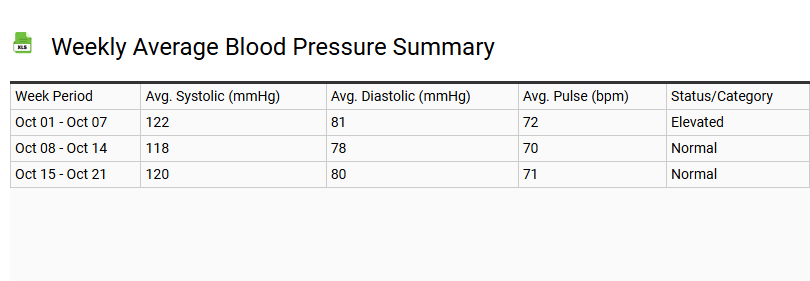
Weekly Average Blood Pressure Summary
💾 Weekly Average Blood Pressure Summary .xls
A Weekly Average Blood Pressure Summary is an essential instrument for monitoring long-term cardiovascular health and effective hypertension management. By aggregating daily readings to calculate the mean values of systolic and diastolic pressure, users can identify significant trends within their circulatory system. This structured data logging format accounts for fluctuating levels caused by stress or activity, providing a more accurate representation of heart health than isolated measurements.
Utilizing this template helps track resting heart rate and arterial tension over a seven-day period, offering clear insights for medical professionals. Consistent medical tracking through these summaries assists in evaluating the efficacy of lifestyle changes or medications. Recording these metrics ensures that hypertensive trends are caught early, fostering proactive wellness and informed clinical decisions based on comprehensive biometric data.
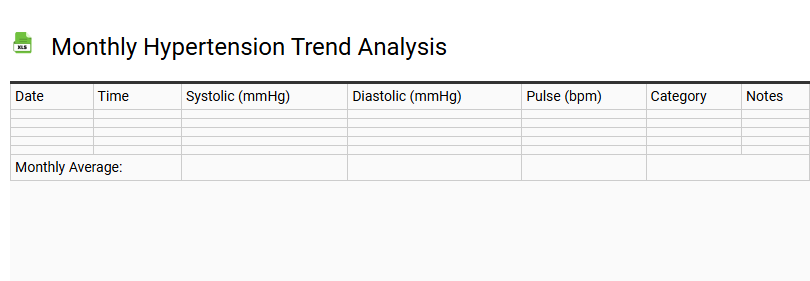
Monthly Hypertension Trend Analysis
💾 Monthly Hypertension Trend Analysis .xls
This tracking framework provides a structured approach for monitoring blood pressure variations over a thirty-day cycle. By documenting daily systolic and diastolic measurements alongside heart rate data, users can visualize fluctuations and identify specific triggers that influence cardiovascular health.
Utilizing this record-keeping system facilitates informed consultations with medical professionals. It highlights essential data points, including:
- Average Pressure Readings: Calculating monthly means to determine overall stability.
- Medication Impact: Observing how prescriptions correlate with reading improvements.
- Lifestyle Correlations: Linking diet, exercise, and stress levels to changes in vascular health.
Maintaining a consistent log ensures that subtle shifts in hypertension status are detected early, supporting proactive management and improved long-term wellness. This data-driven approach transforms raw numbers into actionable insights for better heart health.
Daily BP and Pulse Log with Charts
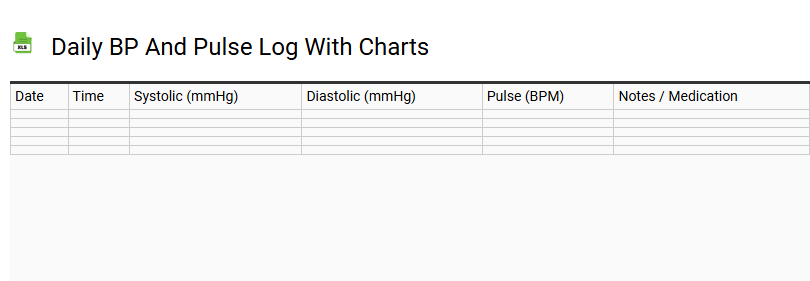
💾 Daily BP and Pulse Log with Charts .xls
This comprehensive Daily BP and Pulse Log serves as a vital tool for proactive cardiovascular health management. Users can systematically record systolic and diastolic pressure readings alongside resting heart rate metrics to identify long-term trends. By utilizing integrated data visualization charts, this template transforms raw numerical data into actionable health insights, making it easier to monitor hypertension or hypotension levels over time.
- Automated Graphing: Tracks blood pressure fluctuations and identifies physiological patterns.
- Vitals Logging: Captures consistent pulse rate frequency for accurate medical record-keeping.
- Clinical Utility: Organizes essential data for physician reviews and telehealth consultations.
- Metric Analysis: Monitors Mean Arterial Pressure (MAP) and pulse pressure variations.
Enhance your wellness routine by maintaining a digital health diary that promotes heart health awareness and precise biometric tracking.
Patient Blood Pressure History Report
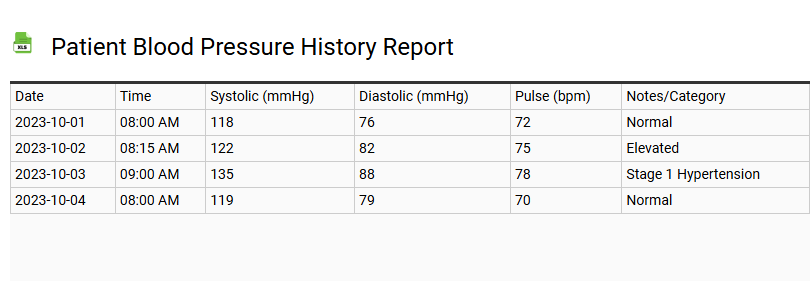
💾 Patient Blood Pressure History Report .xls
This Patient Blood Pressure History Report serves as a robust clinical documentation tool for monitoring cardiovascular health. By systematically logging systolic and diastolic readings, healthcare providers can perform detailed trend analysis to identify hypertension or hypotension risks. This medical record captures essential biometric data, including heart rate and pulse pressure, facilitating accurate physician reviews and diagnostic assessments.
Utilizing a structured measurement log ensures consistent vital signs tracking, which is crucial for evaluating treatment efficacy and long-term patient monitoring. This digital template streamlines the integration of daily blood pressure readings into electronic health systems, enhancing the precision of chronic disease management. Designed for clarity, it supports proactive heart health interventions by providing a comprehensive overview of a patient's hemodynamic stability over time.
Morning and Evening BP Comparison Summary
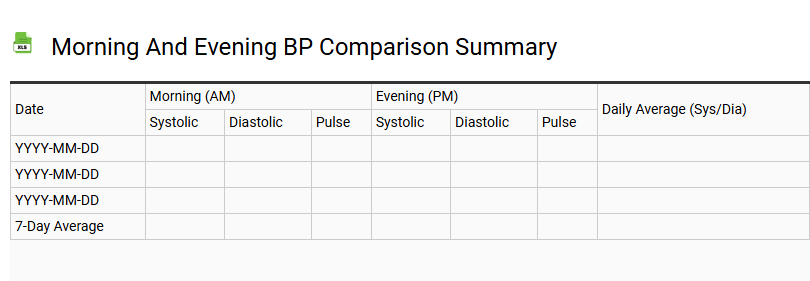
💾 Morning and Evening BP Comparison Summary .xls
Tracking morning and evening blood pressure provides critical insights into your cardiovascular health and circadian rhythm. This comparison summary focuses on systolic and diastolic fluctuations, identifying potential hypertension risks or a non-dipping pattern. Monitoring these diurnal variations is essential for effective hypertension management.
- Morning Readings: Captured before medication or breakfast, these reflect the morning surge and stroke risk indicators.
- Evening Values: These readings highlight the impact of daily stress and the efficacy of antihypertensive therapy.
- Pulse Rate Tracking: Monitors heart rate variability alongside arterial pressure trends.
Consistent home blood pressure monitoring (HBPM) using a digital sphygmomanometer ensures accurate data for medical review. By analyzing these blood pressure logs, patients can achieve hemodynamic stability and optimize treatment timing based on their specific blood pressure profile.
Mean Arterial Pressure Clinical Log
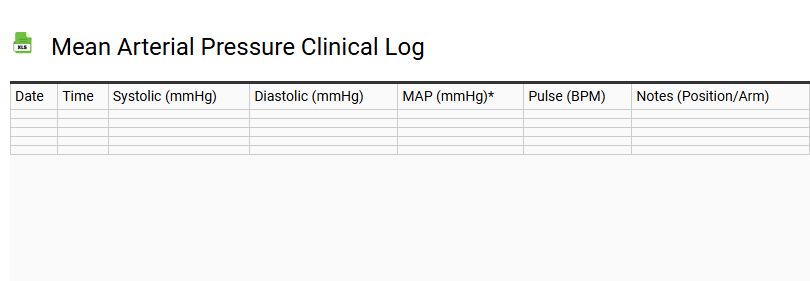
💾 Mean Arterial Pressure Clinical Log .xls
A Mean Arterial Pressure (MAP) clinical log serves as a vital tool for monitoring hemodynamic stability and ensuring adequate organ perfusion. By consistently documenting systolic blood pressure (SBP) and diastolic blood pressure (DBP), healthcare providers can track the average arterial pressure throughout a cardiac cycle. This physiological monitoring is essential for patients at risk of sepsis, hypertension, or cardiovascular instability.
A well-structured log template typically includes data points for:
- Time-stamped vital signs for trend analysis.
- Arterial blood pressure readings (SBP/DBP).
- Calculated MAP values to assess tissue oxygenation.
- Clinical notes regarding vasopressor use or fluid resuscitation.
Maintaining accurate clinical documentation supports proactive patient assessment and timely interventions to prevent hypoperfusion and subsequent organ failure, ensuring optimal cardiovascular health management in acute and chronic care settings.
Blood Pressure Category Distribution Report
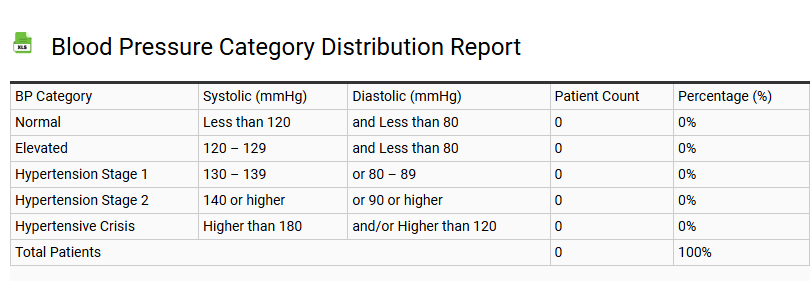
💾 Blood Pressure Category Distribution Report .xls
This Blood Pressure Category Distribution Report provides a structured analysis of arterial pressure readings across a specific demographic. By leveraging systolic and diastolic measurements recorded in mmHg, the template facilitates precise patient stratification. It utilizes standardized diagnostic benchmarks to classify data into key segments: Normal, Elevated, Hypertension Stage 1, Stage 2, and Hypertensive Crisis.
This biometric analysis is essential for population health management, allowing clinicians to visualize physiological trends and assess cardiovascular risk factors. The report serves as a vital tool for clinical documentation, transforming raw circulatory health data into actionable insights. By monitoring the distribution of hypertensive states, healthcare providers can implement targeted interventions, optimize treatment protocols, and improve overall wellness outcomes through comprehensive health metric tracking and data visualization.
Annual Cardiovascular Health Summary
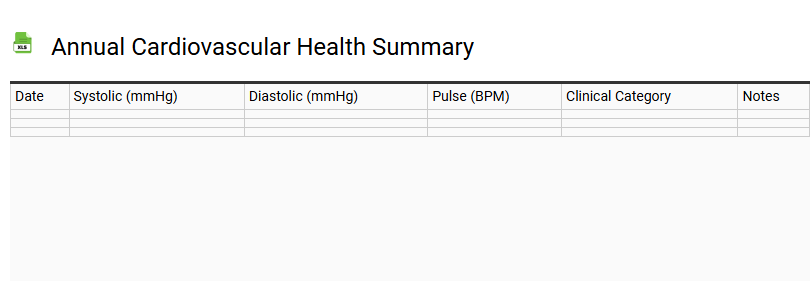
💾 Annual Cardiovascular Health Summary .xls
An annual cardiovascular health summary serves as a comprehensive clinical record tracking essential heart health metrics. This template centralizes critical data, including blood pressure readings, lipid profile results-specifically LDL, HDL, and triglycerides-and resting ECG findings. By documenting these cardiac biomarkers, healthcare providers can perform a longitudinal risk assessment to identify early signs of hypertension or coronary artery disease.
- Detailed cholesterol management tracking.
- Evaluation of metabolic health markers.
- Strategic preventive screening documentation.
Utilizing this standardized format ensures seamless communication between specialists and primary care physicians. It facilitates data-driven lifestyle interventions and therapeutic adjustments, optimizing cardiovascular wellness and reducing the long-term likelihood of myocardial infarction through proactive monitoring of circulatory system efficiency and arterial health.
Medication Adherence and BP Response Tracker
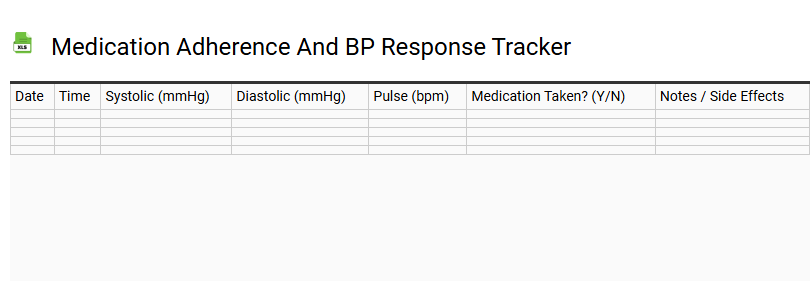
💾 Medication Adherence and BP Response Tracker .xls
A Medication Adherence and BP Response Tracker serves as a vital tool for effective hypertension management. By meticulously documenting daily pharmaceutical intake alongside systolic and diastolic readings, patients can visualize the direct correlation between treatment compliance and cardiovascular health. This structured template facilitates precise health records, allowing healthcare providers to evaluate drug efficacy and adjust dosage protocols based on empirical data. Utilizing such a log enhances patient self-monitoring, ensuring that chronic condition management remains proactive rather than reactive. Accurate tracking of pharmaceutical interventions aids in identifying fluctuations, minimizing risks associated with uncontrolled blood pressure, and improving long-term clinical outcomes. Integrating this systematic approach into daily routines empowers individuals to take control of their therapeutic journey, fostering better communication with medical professionals and optimizing the overall success of hypertension treatment plans.
Clinical Hypertension Dashboard
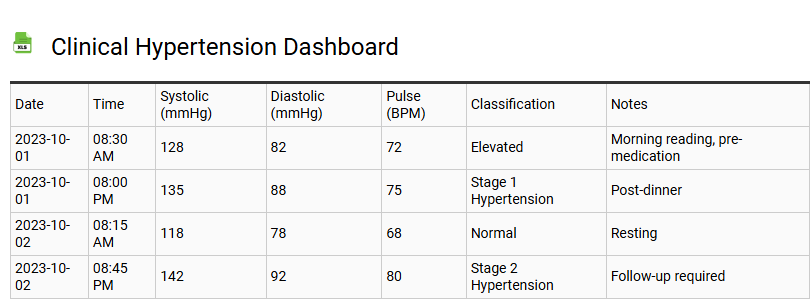
💾 Clinical Hypertension Dashboard .xls
This Clinical Hypertension Dashboard provides a centralized interface for advanced blood pressure monitoring and cardiovascular risk assessment. By consolidating systolic and diastolic data, the template facilitates precise hypertension management through detailed visualization of longitudinal trends.
- EHR Integration: Enables seamless synchronization of patient records for holistic diagnostic insights.
- Medication Adherence: Monitors pharmacological compliance to improve long-term patient outcomes.
- Clinical Decision Support: Features automated alerts for hypertensive urgency and resistant cases.
The dashboard optimizes population health strategies by highlighting high-risk patients requiring immediate intervention. Utilizing real-time data analytics, healthcare providers can refine therapeutic regimens and ensure evidence-based care. This digital tool reduces diagnostic variability, empowering clinical teams to mitigate cardiovascular events through proactive, data-driven monitoring and streamlined workflows within any primary or specialty care setting.
Systolic and Diastolic Trend Summary
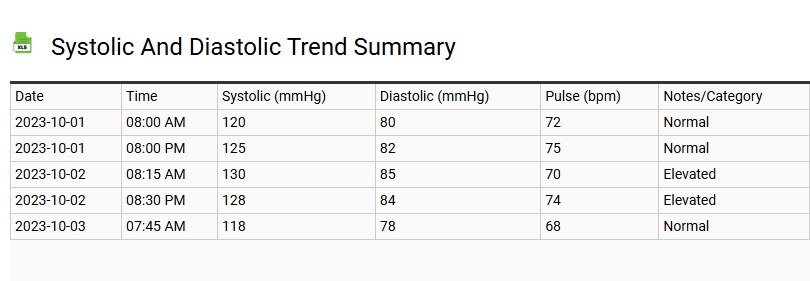
💾 Systolic and Diastolic Trend Summary .xls
Monitoring a systolic and diastolic trend summary is essential for evaluating long-term cardiovascular health and arterial pressure stability. This comprehensive longitudinal report tracks blood pressure readings measured in mmHg, highlighting the force exerted during heart contractions and resting phases. By analyzing these vital signs, users can identify significant fluctuations, hypertension risks, or potential hypotension episodes over time.
Effective circulatory system tracking involves documenting several key metrics:
- Systolic Pressure: Peak arterial force during the cardiac cycle.
- Diastolic Pressure: Minimum pressure maintained between heartbeats.
- Pulse Pressure: The numeric difference between systolic and diastolic values.
- Heart Rate: Concurrent bpm data to correlate with pressure spikes.
Visualizing these biometric data patterns establishes a reliable baseline, assisting healthcare providers in making informed clinical assessments and optimizing preventative wellness strategies.
White Coat Syndrome Monitoring Report
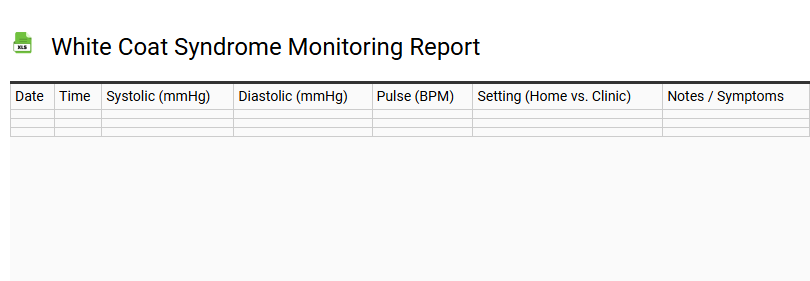
💾 White Coat Syndrome Monitoring Report .xls
A White Coat Syndrome Monitoring Report serves as a vital diagnostic instrument for evaluating blood pressure discrepancies between clinical environments and home settings. This structured template facilitates the systematic tracking of systolic and diastolic readings, allowing healthcare providers to differentiate between chronic hypertension and stress-induced white coat hypertension. By documenting longitudinal data, including heart rate and home-based measurements, the report provides a comprehensive overview of cardiovascular health. Integrating these metrics into a medical evaluation helps eliminate diagnostic bias caused by patient anxiety in a medical office. Utilizing this monitoring tool ensures accurate blood pressure management, supporting informed clinical decisions while preventing unnecessary pharmacological interventions. Each entry captures essential physiological trends, ensuring that medical assessments are based on consistent, real-world data rather than isolated spikes triggered by the clinical setting.
Hypertension Management Progress Log
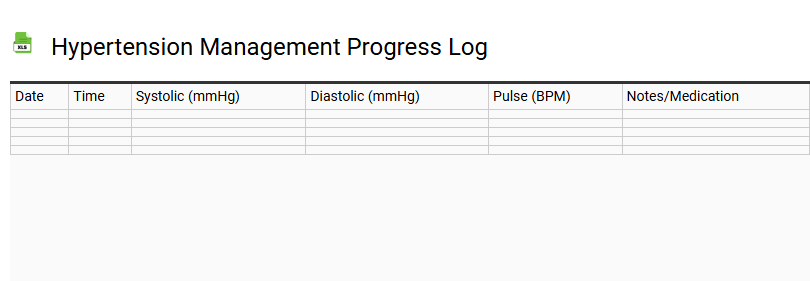
💾 Hypertension Management Progress Log .xls
A Hypertension Management Progress Log is an essential instrument for monitoring cardiovascular health and tracking daily blood pressure readings. By consistently documenting systolic and diastolic metrics, patients can visualize hypertensive trends and assess the impact of lifestyle modifications, such as the DASH diet or reduced sodium intake.
- Medication Adherence: Record daily dosages of antihypertensive drugs to ensure treatment consistency.
- Vital Signs: Monitor resting heart rate alongside pressure levels for a holistic view of vascular health.
- Trigger Identification: Note environmental factors or stress levels that influence circulatory health.
This structured blood pressure logbook empowers users through at-home monitoring, facilitating informed clinical consultations. Accurate data entry supports preventative care strategies, helping to manage chronic hypertension effectively while mitigating long-term risks of stroke or heart failure.
Doctor-Ready BP Log with Statistical Analysis
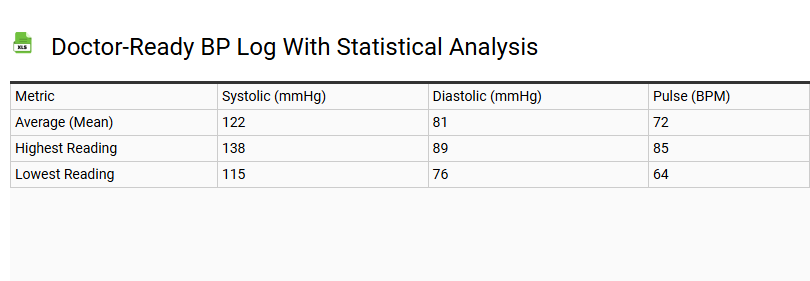
💾 Doctor-Ready BP Log with Statistical Analysis .xls
This blood pressure tracking system streamlines cardiovascular monitoring by organizing daily readings into a professional format. Designed for immediate medical review, the layout captures essential metrics including systolic and diastolic pressure, heart rate, and precise timestamps. Beyond simple data entry, the integrated statistical analysis automatically calculates clinical averages and identifies longitudinal trends over time.
This comprehensive overview assists healthcare providers in making informed adjustments to treatment plans. By documenting medication adherence and symptom correlations alongside objective data, patients provide a clearer diagnostic picture during consultations. The structured interface ensures all entries remain consistent, legible, and actionable. Utilizing this standardized log facilitates proactive heart health management, transforming raw numbers into meaningful insights for improved long-term outcomes and better communication with your physician.
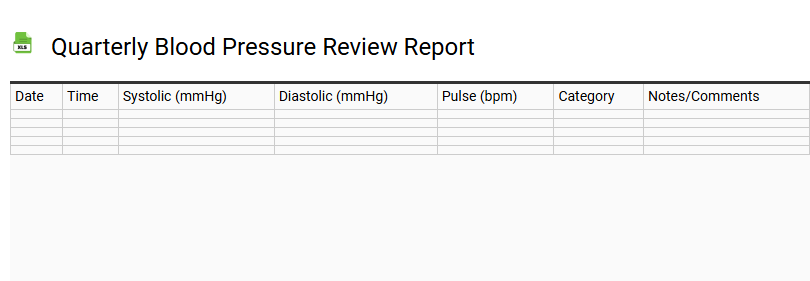
Quarterly Blood Pressure Review Report
💾 Quarterly Blood Pressure Review Report .xls
A Quarterly Blood Pressure Review Report serves as a vital clinical tool for effective hypertension management and long-term cardiovascular health tracking. This comprehensive template facilitates the systematic recording of systolic and diastolic readings, allowing healthcare providers to perform accurate trend analysis over a thirteen-week interval.
Utilizing this report ensures precise medical documentation of patient monitoring data, highlighting the efficacy of current antihypertensive medication regimens. Key components include:
- Mean arterial pressure averages and daily fluctuations.
- Adherence to lifestyle modifications, such as sodium reduction and physical activity.
- Correlation between vital signs and pharmacological interventions.
By synthesizing longitudinal tracking data, clinicians can make informed decisions regarding dosage adjustments or diagnostic refinements, ultimately improving patient health outcomes and reducing risks associated with chronic high blood pressure.
Hypertensive Crisis Alert Log
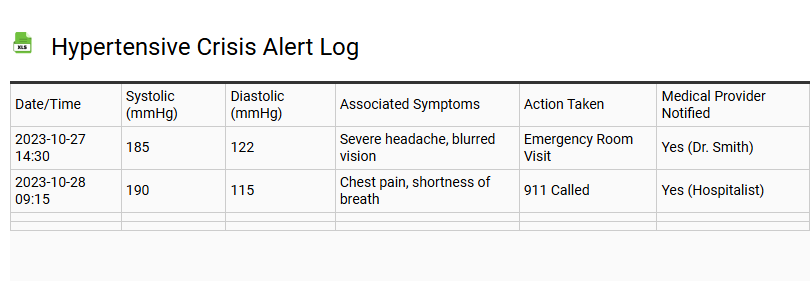
💾 Hypertensive Crisis Alert Log .xls
A hypertensive crisis alert log serves as a vital clinical tool for monitoring severe blood pressure spikes that exceed the 180/120 mmHg threshold. This template facilitates the precise tracking of systolic and diastolic readings, enabling patients and healthcare providers to differentiate between hypertensive urgency and a life-threatening hypertensive emergency.
By documenting consistent sphygmomanometer data alongside associated cardiovascular symptoms-such as chest pain, shortness of breath, or blurred vision-this log provides essential data for immediate medical intervention. Utilizing a structured BP monitoring system improves long-term hypertension management and identifies cardiovascular risk factors in real-time. Essential components for an effective alert log include:
- Precise vital signs timestamps.
- Accompanying symptom checklists for organ damage assessment.
- Current medication adherence and dosages.
- Emergency protocols for cardiovascular health escalation.
Maintaining this record ensures rapid clinical response and improved patient safety during acute hypertensive episodes.
Post-Medication BP Response Summary
💾 Post-Medication BP Response Summary .xls
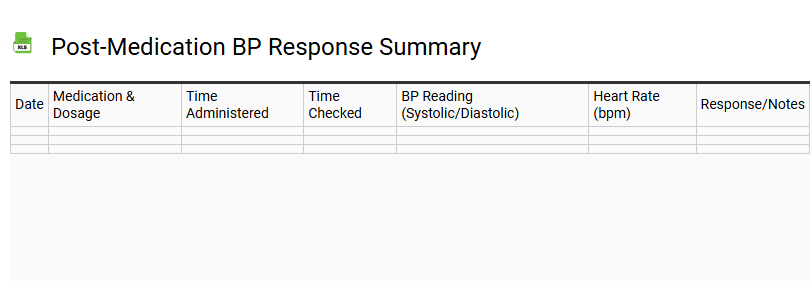
A Post-Medication Blood Pressure Response Summary serves as a clinical record documenting how a patient's circulatory system reacts to specific antihypertensive treatments. This documentation captures the physiological shift between baseline readings and follow-up measurements taken after drug administration.
- Baseline Data: Initial blood pressure and heart rate recorded immediately prior to medication intake.
- Administration Details: The specific medication name, precise dosage, and the exact time the dose was administered.
- Observation Window: Follow-up readings taken at peak efficacy intervals to monitor the maximum therapeutic effect.
- Patient Tolerability: Detailed notation of any reported side effects, such as dizziness or fatigue, during the medication's active period.
This structured information enables healthcare providers to evaluate the effectiveness of a prescribed regimen, facilitating informed adjustments to dosage or timing to ensure optimal cardiovascular stability and patient safety.
Long-term BP Stability Report
💾 Long-term BP Stability Report .xls
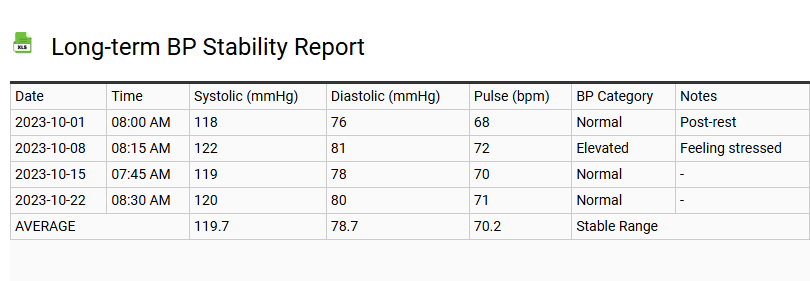
This long-term BP stability report template facilitates comprehensive hypertension management by tracking systolic and diastolic trends over extended periods. It serves as a vital clinical tool for assessing cardiovascular health, utilizing longitudinal data to identify significant blood pressure fluctuations and ensure hemodynamic stability. By documenting medication adherence and lifestyle interventions, the report provides a detailed clinical assessment of therapeutic efficacy. This structured approach to patient monitoring ensures that mean arterial pressure remains within target ranges, minimizing risks associated with hypertensive urgency. Designed for integration into electronic health records, this template streamlines vital sign tracking, offering insights into vascular resistance and heart health. Healthcare providers can leverage these periodic assessments to refine pharmacological protocols and improve patient outcomes through data-driven chronic disease management.
This Clinical Blood Pressure Summary Report template streamlines hypertension management by consolidating vital patient data. It tracks systolic and diastolic trends, heart rate, and mean arterial pressure over time. By utilizing this standardized diagnostic tool, healthcare professionals can enhance medical documentation and improve treatment accuracy for cardiovascular health. This structured format ensures comprehensive monitoring, facilitating better communication between patients and providers. Download this essential resource to optimize clinical workflows and support long-term heart health with precise, actionable insights.