
Continuous Glucose Monitor (CGM) Data Sheet Templates
Managing metabolic health requires precise tracking of glucose levels and blood sugar trends. Utilizing a professional template for a Continuous Glucose Monitor (CGM) data sheet allows patients and clinicians to analyze glycemic control effectively. These logs capture vital sensor data from wearable technology, measuring interstitial fluid to provide a comprehensive overview of daily fluctuations. By organizing information into a structured monitoring system, individuals can better manage diabetic conditions and optimize long-term wellness. Please explore our selection of professionally designed layouts to find the perfect variation of templates below.
Daily CGM Glucose Log
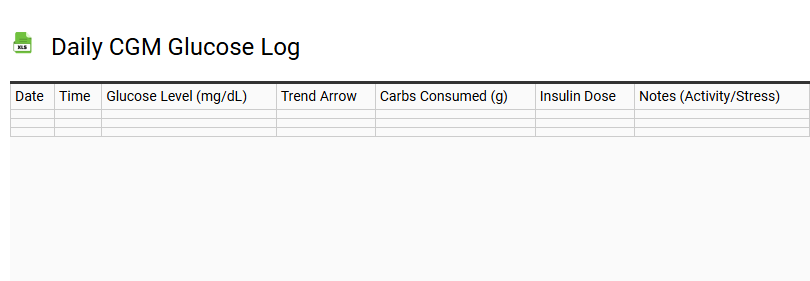
A Daily CGM Glucose Log is an essential instrument for precise diabetes management and metabolic health tracking. By systematically recording data from a continuous glucose monitor, individuals can identify critical blood sugar trends and fluctuations throughout the day.
- Time in Range (TIR): Monitor the percentage of time spent within target glycemic levels.
- Glycemic Variability: Track swings between hyperglycemia and hypoglycemia to stabilize insulin sensitivity.
- Activity Correlation: Document how meals, exercise, and stress impact interstitial fluid glucose readings.
This template facilitates the analysis of sensor data, allowing for data-driven adjustments to therapy. Consistent logging provides a comprehensive overview of glycemic control, bridging the gap between fingerstick snapshots and real-time glucose profiles for improved long-term clinical outcomes.
Weekly Time in Range Summary
💾 Weekly Time in Range Summary .xls
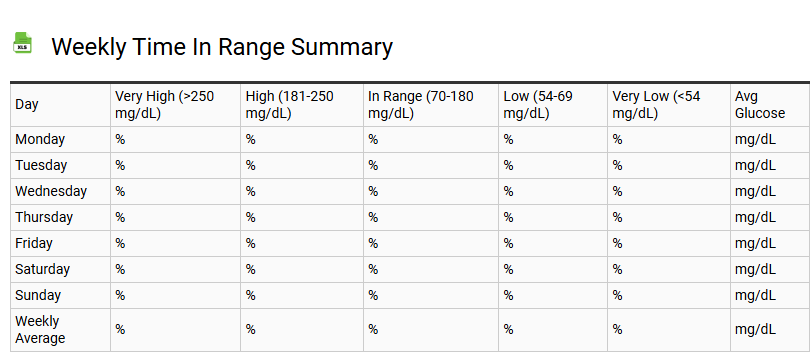
A Weekly Time in Range (TIR) Summary serves as a vital analytical tool for effective diabetes management. This template systematically tracks blood sugar levels, capturing the specific percentage of time a patient remains within their optimal target glucose range (typically 70–180 mg/dL). By integrating data from a Continuous Glucose Monitor (CGM), the report highlights essential glycemic control metrics, including episodes of hypoglycemia and hyperglycemia.
- Mean Glucose: The average of all readings over the seven-day period.
- Glucose Management Indicator (GMI): An estimated A1c derived from recent sensor data.
- Glucose Variability: Insights into the frequency and magnitude of blood sugar fluctuations.
Evaluating these glycemic trends allows clinicians and patients to visualize metabolic health patterns, adjust insulin sensitivity factors, and optimize therapeutic outcomes through precise, actionable health data insights.
CGM and Insulin Dosage Tracker
💾 CGM and Insulin Dosage Tracker .xls
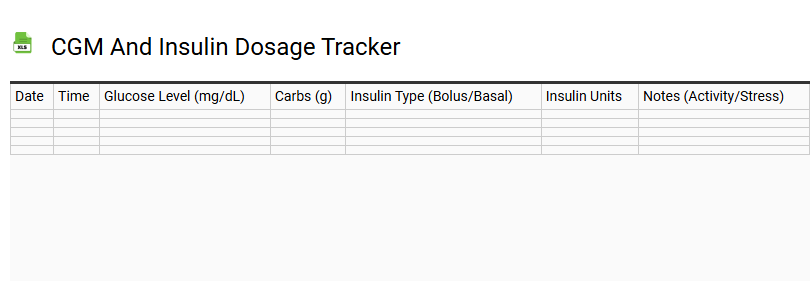
Utilizing a CGM and Insulin Dosage Tracker is essential for achieving optimal glycemic control and managing long-term metabolic health. This comprehensive template integrates real-time data from continuous glucose monitors with precise logs of basal rates and bolus insulin administration. By tracking blood glucose levels alongside carbohydrate intake, users can identify critical glucose trends and evaluate insulin sensitivity.
Whether managing type 1 or type 2 diabetes, this digital logbook facilitates data-driven adjustments to therapy. Monitoring interstitial fluid readings and subcutaneous sensor data helps prevent hypoglycemia and hyperglycemia. By synchronizing glucose monitoring metrics with insulin delivery, patients and healthcare providers can refine endocrine wellness strategies, ensuring a holistic approach to daily diabetes care and improved physiological outcomes through structured data analysis.
24 Hour Glucose Pattern Analysis
💾 24 Hour Glucose Pattern Analysis .xls
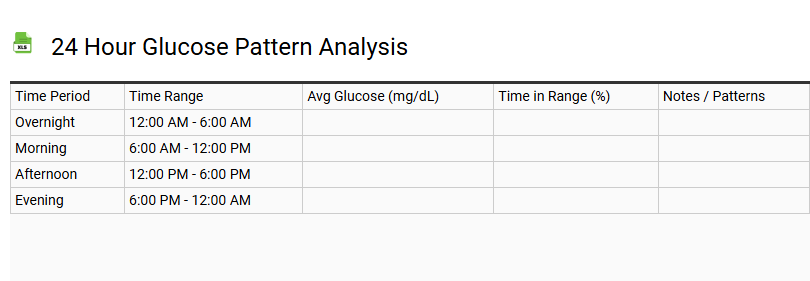
A 24-hour glucose pattern analysis template provides a comprehensive visualization of glycemic variability throughout a full circadian cycle. By utilizing continuous glucose monitoring (CGM) data, clinicians can accurately track time in range (TIR) and identify critical fluctuations in interstitial fluid readings. This systematic approach highlights postprandial spikes, nocturnal hypoglycemia risks, and fasting blood sugar stability.
Integrating these metrics into a standardized ambulatory glucose profile (AGP) facilitates precise adjustments in medication, nutrition, and lifestyle. Effective analysis maps glucose trends against daily activities to optimize metabolic health and long-term glycemic control. This structured data interpretation is essential for recognizing hidden patterns that traditional fingerstick testing might overlook, ensuring a more nuanced understanding of a patient's endocrine response and overall diabetes management strategy.
Carbohydrate and Glucose Correlation Sheet
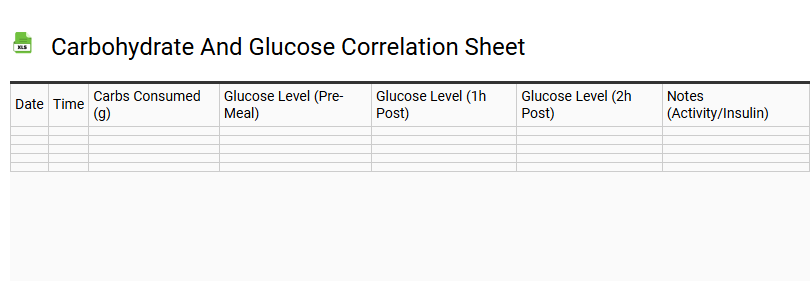
💾 Carbohydrate and Glucose Correlation Sheet .xls
Utilizing a Carbohydrate and Glucose Correlation Sheet is a vital strategy for precise metabolic health monitoring. This structured template facilitates the systematic tracking of dietary intake alongside fluctuations in blood sugar levels to determine individual glycemic responses. By documenting net carbohydrates, fiber content, and postprandial glucose readings, users can effectively identify insulin sensitivity patterns and mitigate hyperglycemic spikes.
Comprehensive diabetic management requires analyzing how complex carbohydrates and simple sugars impact bloodstream glucose concentration over time. This macronutrient tracking tool bridges the gap between nutritional logging and physiological outcomes, allowing for data-driven lifestyle adjustments. Integrating this correlation log helps optimize the glycemic index of meals, ensuring stabilized energy levels and improved long-term wellness through meticulous biometric data observation and nutritional synchronization.
Glycemic Variability Dashboard
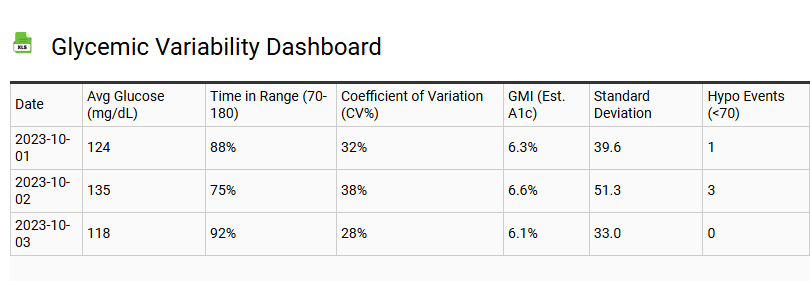
💾 Glycemic Variability Dashboard .xls
This glycemic variability dashboard provides a comprehensive analytical interface for tracking blood glucose fluctuations and metabolic stability. By synthesizing data from continuous glucose monitors (CGM), the template visualizes essential metrics such as Time in Range (TIR), mean glucose, and the coefficient of variation (%CV). These indicators are crucial for assessing the frequency and magnitude of hyperglycemia and hypoglycemia episodes.
The dashboard leverages standard deviation (SD) and postprandial glucose trends to offer deep insights into a patient's glycemic profile. Optimized for diabetic analytics, the layout highlights patterns in insulin sensitivity and glucose excursions. Utilizing this digital health tool allows for precise metabolic monitoring, helping clinicians and users reduce glucose instability. By transforming raw biometric data into actionable therapeutic insights, the template facilitates better long-term glycemic control and minimizes the risk of diabetes-related complications.
Exercise Impact CGM Log
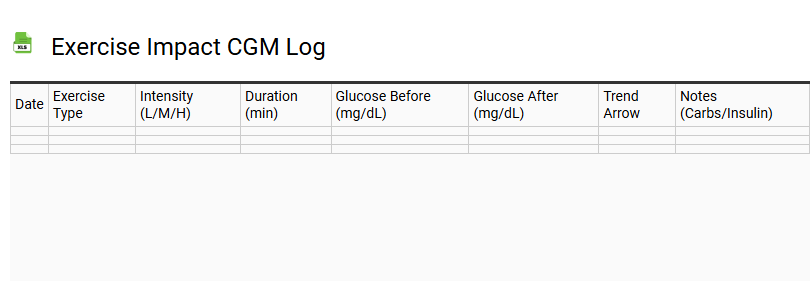
💾 Exercise Impact CGM Log .xls
A comprehensive Exercise Impact CGM Log is essential for tracking how physical activity influences blood glucose levels and metabolic health. By documenting aerobic and anaerobic workouts alongside Continuous Glucose Monitor (CGM) data, users can identify specific patterns in insulin sensitivity and glycemic variability.
This template captures vital metrics such as pre-workout glucose, intensity levels, and post-exercise recovery to mitigate risks of hypoglycemia or late-onset glucose spikes. Monitoring the metabolic response to various training loads helps optimize Time in Range (TIR) and refine nutritional timing. Integrating real-time sensor data with structured activity logs empowers individuals to manage post-prandial glucose more effectively while improving long-term glucose stability. Use this data-driven approach to master the synergy between physical exertion and biometric trends.
Post-Prandial Glucose Spike Tracker
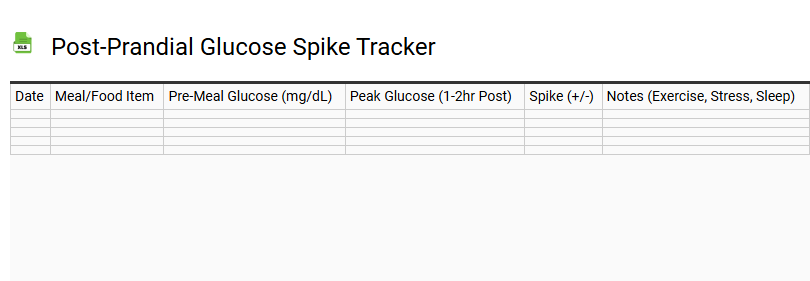
💾 Post-Prandial Glucose Spike Tracker .xls
A post-prandial glucose spike tracker is an essential tool for monitoring the body's glycemic response following food consumption. By recording blood sugar levels after meals, individuals can identify glucose variability and assess their insulin sensitivity. This template facilitates the logging of pre-meal baselines and peak glucose values, offering a clear view of how specific carbohydrates impact metabolic health.
Utilizing this data alongside a continuous glucose monitor (CGM) helps manage hyperinsulinemia and stabilize glycemic load. Detailed tracking of post-meal readings assists in flattening the glucose curve, reducing the risk of Type 2 diabetes, and improving long-term A1c results. Documenting meal composition and interstitial fluid trends empowers users to achieve metabolic flexibility and maintain homeostasis through informed dietary adjustments and lifestyle interventions.
Nighttime Basal Rate Adjustment Sheet
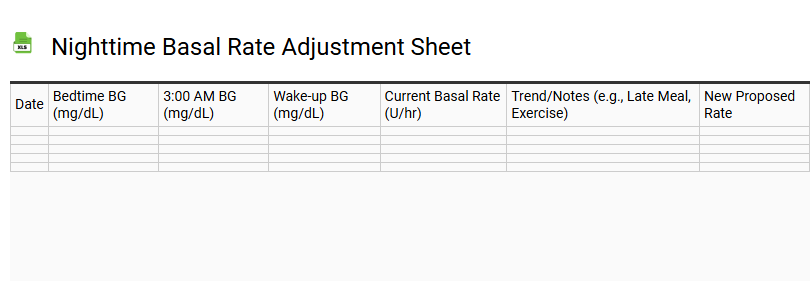
💾 Nighttime Basal Rate Adjustment Sheet .xls
A Nighttime Basal Rate Adjustment Sheet is an essential clinical tool designed to achieve overnight glucose stability. By tracking blood sugar fluctuations between bedtime and waking, patients can identify critical fasting trends and address issues like the dawn phenomenon or nocturnal hypoglycemia. This structured log facilitates precise basal dose titration for those utilizing insulin pump settings or long-acting background insulin.
Effective optimization involves monitoring several key variables:
- CGM data integration for continuous trend analysis.
- Scheduled midnight and 3:00 AM blood glucose checks.
- Assessment of insulin sensitivity during sleep cycles.
Refining these rates ensures glycemic control remains within the target range, preventing rebound hyperglycemia. Consistent documentation allows for data-driven adjustments to hourly basal rates, improving metabolic safety and long-term diabetes management outcomes.
Monthly CGM Trend Report
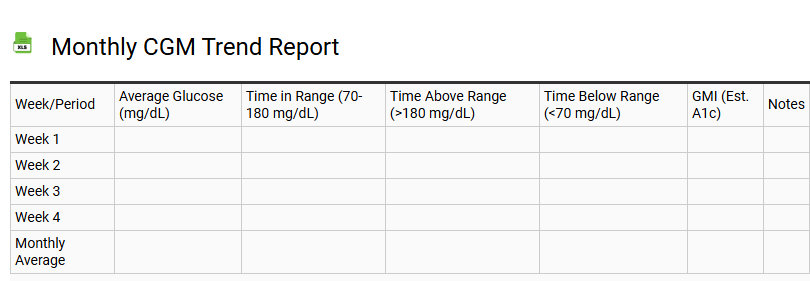
💾 Monthly CGM Trend Report .xls
A Monthly CGM Trend Report serves as a vital diagnostic tool for evaluating long-term glycemic control. By synthesizing data from a Continuous Glucose Monitor, this template visualizes Time in Range (TIR), average glucose levels, and glycemic variability over a thirty-day cycle. Utilizing the Ambulatory Glucose Profile (AGP), the report identifies recurring patterns of hypoglycemia and hyperglycemia, offering insights into metabolic responses to carbohydrate intake and physical activity.
Integrating these metrics allows clinicians to refine insulin sensitivity factors and adjust therapeutic interventions effectively. Tracking longitudinal glucose trends is essential for reducing A1c percentages and preventing long-term complications. This structured data visualization transforms complex glucose telemetry into actionable insights, empowering patients to achieve stable blood sugar homeostasis and optimized metabolic health through proactive diabetes management.
Estimated A1c Tracking Worksheet
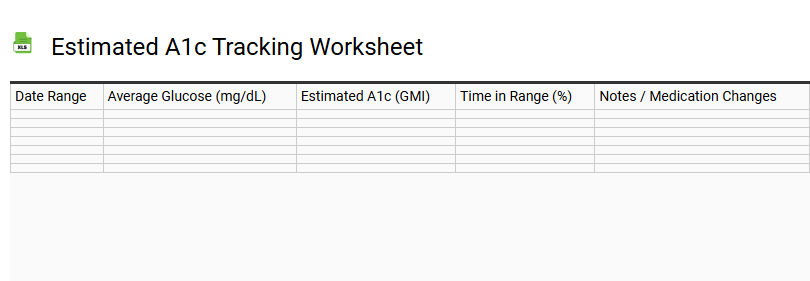
💾 Estimated A1c Tracking Worksheet .xls
An Estimated A1c Tracking Worksheet serves as a vital diabetes management tool for monitoring glycemic control between clinical laboratory tests. By consistently logging blood glucose levels from a glucose meter, users can calculate their Estimated Average Glucose (eAG). This proactive approach to health tracking allows for the identification of patterns in blood sugar fluctuations and assists in predicting professional hemoglobin A1c results.
- Precise documentation of daily glucose readings and postprandial levels.
- Evaluation of long-term blood sugar trends to improve metabolic health.
- Enhanced communication with healthcare providers regarding insulin sensitivity.
- Improved diabetes self-management through data-driven adjustments.
Utilizing a structured glucose log helps bridge the gap between daily monitoring and clinical diagnostic testing, empowering individuals to maintain stable glucose ranges and reduce the risk of long-term complications.
CGM Sensor Change Log
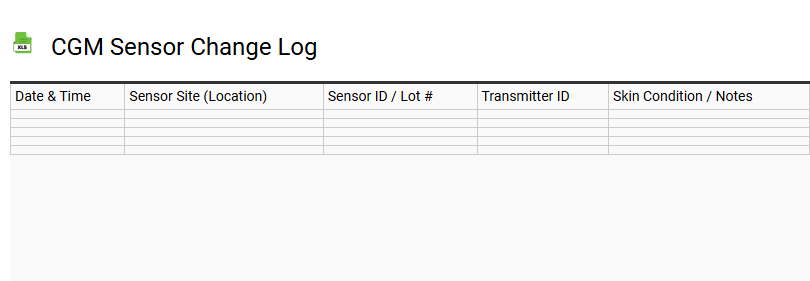
A structured CGM sensor change log is essential for optimizing glycemic control and ensuring the accuracy of continuous glucose monitoring systems. By documenting each insertion site and transmitter connection, users can implement effective site rotation to prevent lipohypertrophy and skin irritation.
Key data points to track within your log include:
- Sensor life duration and expiration alerts.
- Specific anatomical application points for wearable technology.
- Adhesive patch integrity and skin prep methods.
- Calibration data and interstitial fluid reading correlations.
Maintaining a detailed history of medical hardware performance helps identify glucose trends and potential device failures. Whether using Dexcom, Freestyle Libre, or Medtronic systems, consistent logging enhances the reliability of real-time data for more informed diabetes management decisions.
Fast-Acting Insulin Response Monitor
💾 Fast-Acting Insulin Response Monitor .xls
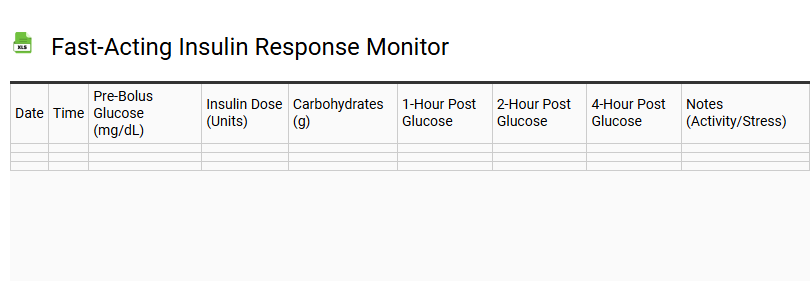
A fast-acting insulin response monitor serves as a sophisticated tracking template designed to optimize glycemic control by analyzing the rapid absorption kinetics of bolus doses. This digital tool enhances diabetes management by providing real-time data on postprandial glucose levels and individual insulin sensitivity. By calculating active insulin (insulin on board), users can accurately predict metabolic responses and effectively prevent hyperglycemia or dangerous hypoglycemia dips.
- Detailed blood glucose logging for improved A1C outcomes.
- Dynamic tracking of carbohydrate-to-insulin ratios.
- Visualizing glycemic variability alongside continuous glucose monitor (CGM) inputs.
Implementing this structured framework allows for precise bolus timing, ensuring insulin peaks align with nutrient absorption. This data-driven approach minimizes glucose excursions and empowers patients to refine their correction factors for superior long-term metabolic health.
Interceptive Glucose Pattern Finder
💾 Interceptive Glucose Pattern Finder .xls
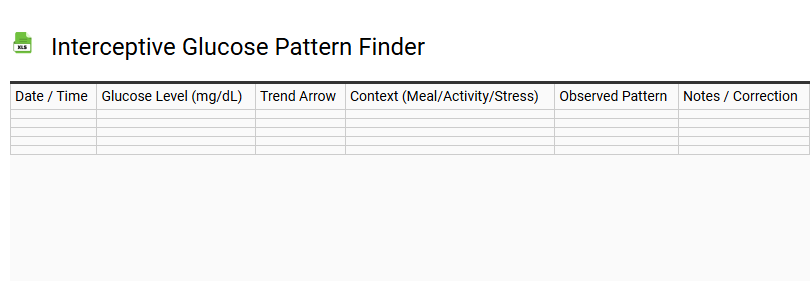
The Interceptive Glucose Pattern Finder template is a sophisticated tool designed for comprehensive glycemic variability analysis. By meticulously tracking blood sugar levels, this framework identifies critical metabolic health trends and frequent glucose spikes. Utilizing CGM data or manual logs, the template facilitates the early detection of hyperglycemia and hypoglycemia episodes, enhancing insulin sensitivity awareness. This systematic approach to glucose management allows users to correlate dietary triggers with biometric tracking results. By visualizing glycemic load and physiological responses, individuals can implement proactive health optimization strategies. Integrating this data analysis tool into daily routines empowers better metabolic stability, helping to maintain a target glycemic range while reducing the risks associated with insulin resistance. Ultimately, this structured glucose monitoring resource serves as an essential guide for data-driven wellness and long-term metabolic resilience.
Diabetes Management CGM Dashboard
💾 Diabetes Management CGM Dashboard .xls
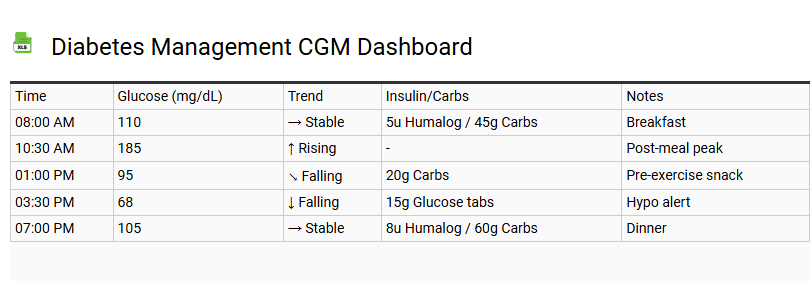
This Diabetes Management CGM Dashboard template provides a sophisticated interface for interpreting Continuous Glucose Monitoring data. Designed for optimal glycemic control, it centralizes real-time blood sugar trends and glycemic variability metrics to enhance patient outcomes. By visualizing Time in Range (TIR), users can identify patterns in interstitial fluid glucose levels, facilitating precise adjustments to insulin therapy and metabolic health strategies.
- Hyperglycemia and hypoglycemia alert history for proactive risk management.
- Analytical overlays for postprandial glucose response and overnight stability.
- Estimated HbA1c tracking based on cumulative sensor glucose telemetry.
This digital health tool transforms complex diabetes technology data into actionable insights, supporting data-driven decisions for Type 1 and Type 2 diabetes management within a seamless, user-centric dashboard environment optimized for clinical accuracy and self-care efficiency.
In summary, utilizing a Continuous Glucose Monitor data sheet is vital for mastering glycemic control. This template organizes sensor readings and blood sugar levels, providing a clear visual of glucose trends.
By documenting interstitial fluid data, patients improve their diabetic management and metabolic health. Ultimately, a structured glucose monitoring log empowers users to share precise insights with healthcare providers, fostering proactive adjustments. Adopting this systematic approach ensures better health outcomes through consistent, accurate biometric tracking and informed lifestyle choices.