
Customizable Fitness Goal Metric Chart Template
Maximize your physical transformation with a customizable fitness goal metric chart designed for precision. This dynamic tool empowers users to monitor workout performance, track body composition shifts, and visualize health analytics in one comprehensive interface. By inputting specific exercise milestones, you create a personalized dashboard that simplifies progress tracking throughout your fitness journey. Whether focusing on weight loss or strength training, these data-driven layouts provide the clarity needed to sustain long-term motivation. Please explore our diverse collection of professionally designed template variations listed below.
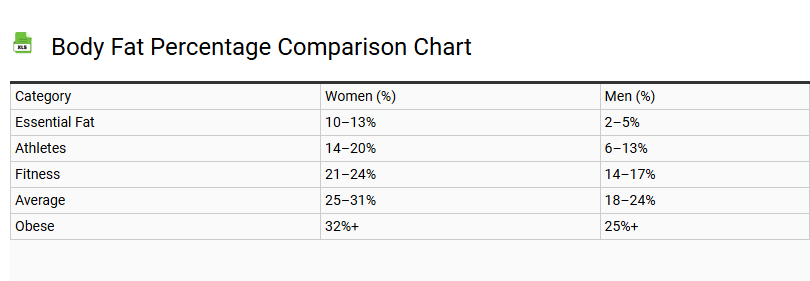
Body Fat Percentage Comparison Chart
💾 Body Fat Percentage Comparison Chart .xls
A body fat percentage comparison chart serves as a comprehensive tool for evaluating body composition beyond basic weight metrics. This template provides a detailed visual reference to help individuals distinguish between lean muscle mass and adipose tissue. Unlike the standard body mass index, these metrics offer a deeper health assessment by categorizing fitness levels-ranging from elite athletes to those within obesity ranges.
By utilizing anthropometric measurements, users can track subcutaneous fat distribution and monitor essential fat levels necessary for physiological function. This structured data is vital for anyone focused on metabolic health or body recomposition. Whether you are analyzing lipid profiles or setting physical conditioning goals, this comparison guide ensures accurate tracking of biological markers and overall wellness progress through standardized body fat classifications.
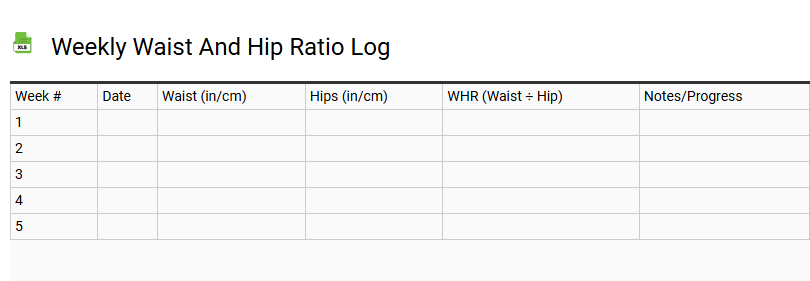
Weekly Waist and Hip Ratio Log
💾 Weekly Waist and Hip Ratio Log .xls
Utilizing a Weekly Waist and Hip Ratio Log is a strategic method for monitoring body fat distribution and overall metabolic health. Unlike standard weight scales, this tracking tool focuses on abdominal obesity and the presence of visceral fat, offering a clearer picture of potential cardiovascular health risks. By consistently recording circumference measurements using a flexible measuring tape, individuals can visualize body composition changes over time.
- Waist Measurement: Taken at the narrowest point above the navel.
- Hip Measurement: Recorded at the widest part of the glutes.
- WHR Calculation: Dividing waist by hip to determine fat distribution patterns.
- Progress Tracking: Identifying fitness goals and weight management success.
Maintaining this log facilitates trend analysis, helping users distinguish between "apple-shaped" and "pear-shaped" profiles to optimize long-term wellness and disease prevention through data-driven health assessments.
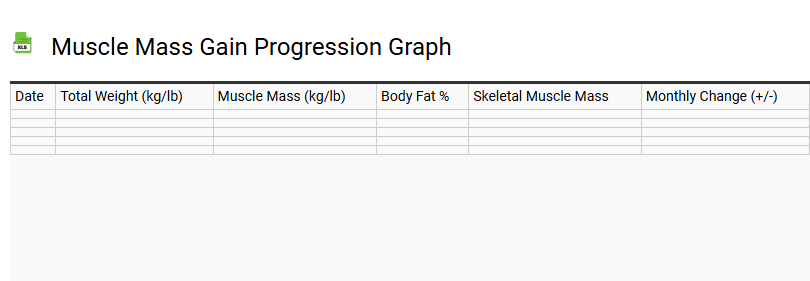
Muscle Mass Gain Progression Graph
💾 Muscle Mass Gain Progression Graph .xls
This muscle mass gain progression graph serves as a sophisticated analytical tool for monitoring hypertrophy and lean body mass development over time. By visualizing skeletal muscle accrual, users can effectively track body composition shifts and evaluate the efficacy of their resistance training protocols. This template integrates vital fitness analytics, allowing for the precise mapping of progressive overload and total training volume.
Monitoring these biometric data points is essential for identifying potential growth plateaus and optimizing a caloric surplus to meet specific aesthetic goals. By documenting strength metrics alongside physical measurements, this framework ensures a data-driven approach to physical transformation. Utilizing a structured progression graph empowers athletes to refine their hypertrophy strategies, ensuring consistent muscular development through evidence-based tracking and periodic adjustments to their training intensity and recovery cycles.
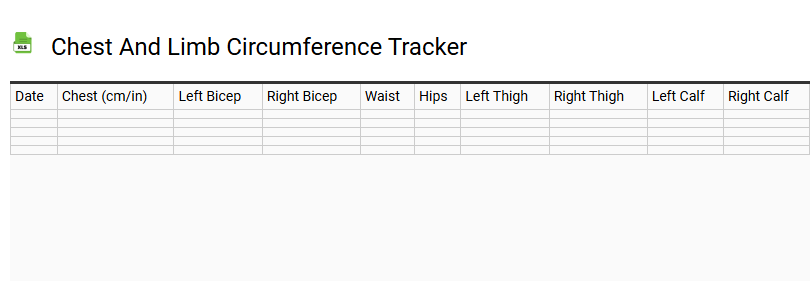
Chest and Limb Circumference Tracker
💾 Chest and Limb Circumference Tracker .xls
This comprehensive chest and limb circumference tracker template is an essential tool for monitoring body composition and physical transformations. By documenting precise anthropometric data, users can effectively analyze muscle hypertrophy and fat loss progress beyond basic scale weight. This structured log facilitates the recording of bicep girth, thigh circumference, and chest expansion, providing a detailed overview of your fitness journey.
Utilizing a tape measure for consistent body measurements ensures high accuracy when tracking skeletal muscle development or weight management milestones. This template allows for data-driven insights into body symmetry and physique changes, making it easier to adjust nutrition and training protocols. By maintaining a regular tracking trend, you gain a professional-grade method to visualize fitness progress and stay motivated toward your long-term health goals.
Lean Body Mass vs Fat Mass Table
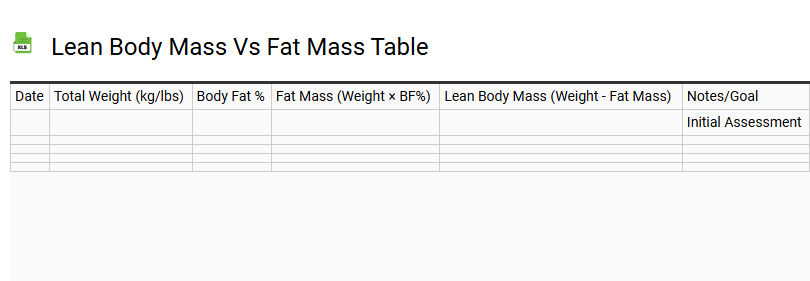
💾 Lean Body Mass vs Fat Mass Table .xls
Distinguishing between lean body mass and fat mass is essential for understanding physical composition. Lean body mass encompasses everything except adipose tissue, including skeletal muscle, bone density, and vital organs. In contrast, fat mass represents the total weight of stored lipids within the body.
A comparative table organizes these metrics to provide a detailed snapshot of health progress. This structure allows for:
- Monitoring muscle preservation during weight loss phases.
- Tracking changes in body fat percentage relative to total weight.
- Evaluating the effectiveness of strength training and nutritional protocols.
By separating these two components, individuals can focus on functional improvements rather than just fluctuations on a scale. This clarity supports long-term wellness goals by prioritizing the maintenance of metabolically active tissue while managing body fat levels effectively.
Total Body Inches Lost Dashboard
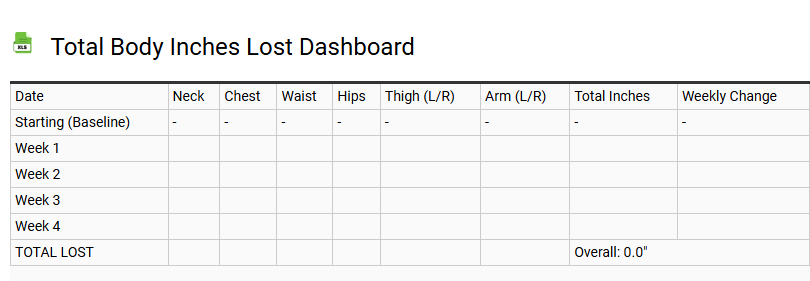
💾 Total Body Inches Lost Dashboard .xls
Utilizing a total body inches lost dashboard is essential for tracking physical transformation through precise circumference measurements. This data-driven template offers a comprehensive overview of your fitness journey, aggregating metrics from the waist, hips, chest, and limbs to calculate overall progress. By focusing on body recomposition rather than just weight, users gain deeper insights into fat loss and muscle definition.
The integrated analytics within this reporting tool allow for seamless visualization of biometric data trends over time. Using a tape measure to log consistent data points ensures accuracy in your performance tracking. This dashboard serves as a central hub for monitoring structural changes, providing the necessary fitness analytics to validate your hard work and keep your health goals on target. Optimize your body measurement tracking with this streamlined digital solution for holistic health monitoring.
BMI and BMR Tracking Sheet
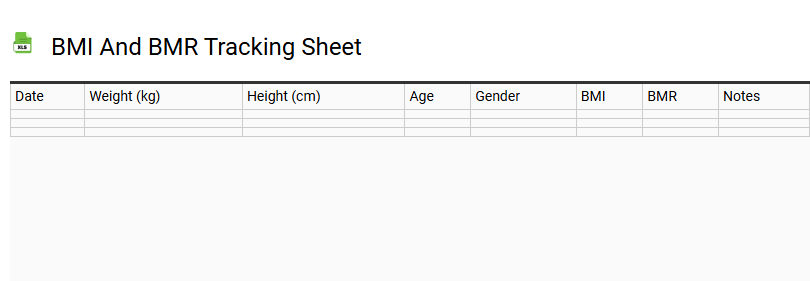
💾 BMI and BMR Tracking Sheet .xls
This comprehensive BMI and BMR tracking sheet serves as a vital tool for monitoring core health metrics and body composition. By utilizing this template, users can engage in data-driven weight management, tracking their Body Mass Index to assess weight categories and Basal Metabolic Rate to understand calories burned at rest.
Integrating these indicators into your fitness routine allows for the precise adjustment of caloric intake and physical activity levels. The log accounts for essential variables such as age, height, and gender, providing insights into your Total Daily Energy Expenditure (TDEE). Whether your objective is fat loss, muscle gain, or maintaining metabolic health, this digital tracker simplifies nutrition logging and wellness data analysis. Use this template to refine your dietary habits and achieve long-term fitness goals through consistent health monitoring and evidence-based progress tracking.
Bicep and Thigh Measurement Log
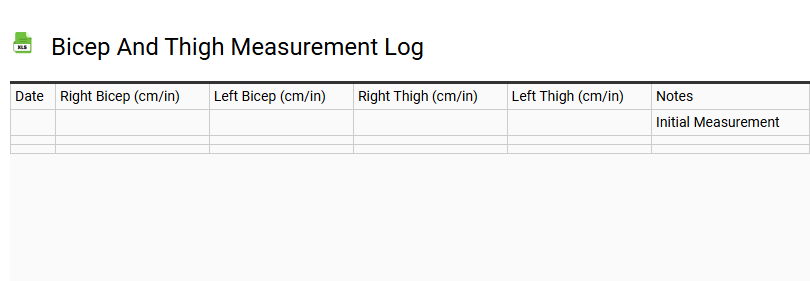
💾 Bicep and Thigh Measurement Log .xls
A bicep and thigh measurement log serves as a vital instrument for monitoring muscle hypertrophy and body composition shifts over time. By utilizing a standardized template, individuals can accurately track anthropometric data, recording the precise circumference of upper arms and legs to validate the efficacy of their strength training regimen. This systematic approach allows for the documentation of bilateral symmetry, ensuring balanced development between the left and right limbs.
Consistent use of a flexible tape measure alongside this log provides quantitative evidence of physique progress, which often surpasses the accuracy of a standard scale. Recording these body metrics helps fitness enthusiasts identify plateaus, adjust caloric intake, and optimize muscle protein synthesis. Ultimately, this log is a cornerstone for body sculpting, offering a clear visual of hypertrophy gains and long-term fitness transformation goals.
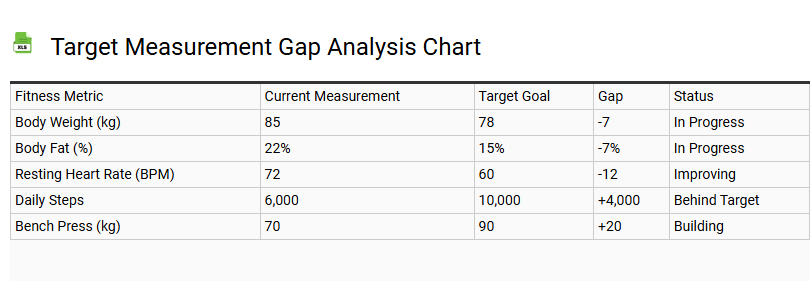
Target Measurement Gap Analysis Chart
💾 Target Measurement Gap Analysis Chart .xls
A target measurement gap analysis chart template serves as a vital strategic tool for identifying discrepancies between current performance and desired future state objectives. By visualizing the "as-is" landscape alongside target benchmarks, organizations can pinpoint specific performance deficiencies and operational inefficiencies. This analytical framework utilizes key performance indicators (KPIs) and quantitative metrics to measure the variance in strategic outcomes. Implementing such a template facilitates data-driven decision-making, allowing stakeholders to prioritize resource allocation and develop corrective action plans. By bridging the distance between actual results and projected goals, the chart enhances transparency in performance tracking and goal attainment. It streamlines the evaluation of organizational growth, ensuring that teams remain aligned with long-term mission milestones while optimizing tactical workflows for continuous improvement and sustainable competitive advantage.
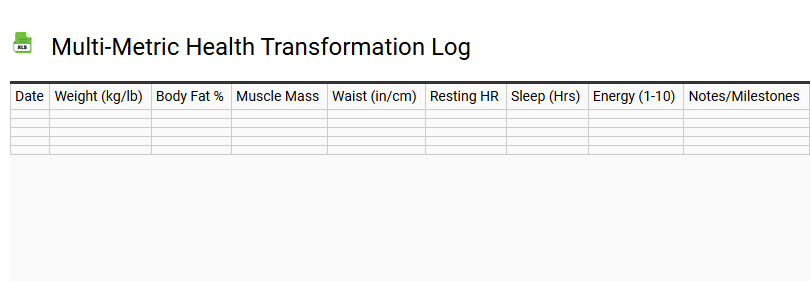
Multi-Metric Health Transformation Log
💾 Multi-Metric Health Transformation Log .xls
A Multi-Metric Health Transformation Log serves as a comprehensive framework for tracking a holistic wellness journey. By integrating diverse physiological markers and lifestyle variables, this template facilitates a data-driven approach to personal health optimization. Users can systematically document body composition, metabolic indicators, and daily nutritional adherence to identify meaningful correlations between habits and outcomes.
- Biometric Data: Monitor resting heart rate, blood pressure, and sleep architecture.
- Performance Analytics: Log cardiovascular endurance, functional strength gains, and recovery scores.
- Bio-indicators: Track blood glucose levels, hydration, and hormonal balance markers.
Utilizing this structured format empowers individuals to visualize long-term health trends and refine their fitness strategies through objective evidence. By focusing on bio-individual feedback, the log transforms raw data into actionable insights, ensuring sustainable progress toward physical and cognitive enhancement goals while maintaining overall metabolic flexibility.
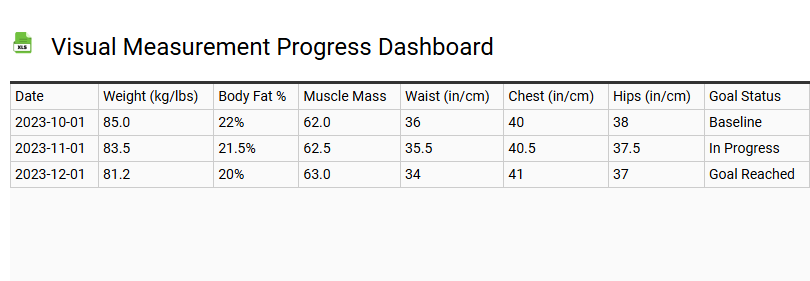
Visual Measurement Progress Dashboard
💾 Visual Measurement Progress Dashboard .xls
This Visual Measurement Progress Dashboard template offers a robust framework for real-time KPI tracking and comprehensive performance monitoring. Designed with a focus on data visualization, the layout incorporates interactive charts, progress bars, and status indicators to streamline goal attainment analysis.
Key features include:
- Data-driven insights via dynamic dashboard widgets.
- Granular metric tracking for project milestones.
- Trend analysis tools to evaluate operational efficiency.
- High-fidelity UI design for improved user engagement.
By leveraging this analytics template, stakeholders can transform complex quantitative data into actionable intelligence. The information architecture is optimized for at-a-glance reporting, ensuring teams maintain alignment with strategic objectives through precise visual cues and performance benchmarks.
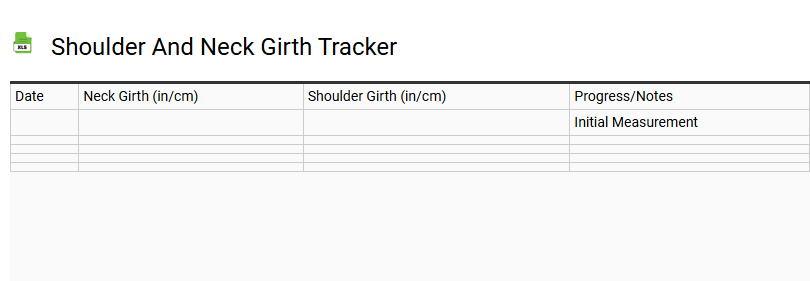
Shoulder and Neck Girth Tracker
💾 Shoulder and Neck Girth Tracker .xls
Optimizing your physical transformation requires a precise shoulder and neck girth tracker to monitor upper body evolution. This biometric logging tool is essential for bodybuilding progress, allowing athletes to quantify muscle hypertrophy within the deltoids and clavicular frame. Tracking neck circumference serves as a vital health indicator, offering insights into adipose tissue distribution and potential metabolic risks.
By consistently recording anatomical dimensions, users can visualize structural changes, improve posture alignment, and ensure accurate tailoring measurements for bespoke apparel. This template facilitates longitudinal data analysis, helping you correlate resistance training cycles with actual body composition shifts. Whether your goal is aesthetic symmetry or monitoring cervical girth for fitness health, maintaining a detailed log ensures your hypertrophy-focused goals remain data-driven and achievable through precise biometric monitoring and periodic assessment.
Custom Weight and Dimension Metric Chart
💾 Custom Weight and Dimension Metric Chart .xls
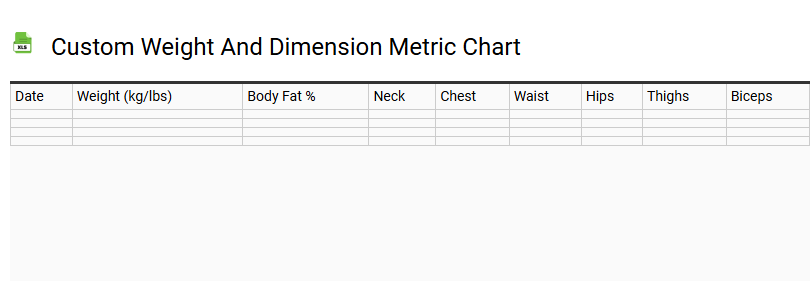
A Custom Weight and Dimension Metric Chart serves as a critical logistics tool for maintaining precise product specifications and freight calculations. By integrating standardized measurement units-such as kilograms, pounds, centimeters, and inches-this template ensures high-fidelity SKU mapping across global supply chains. Optimized for warehouse management systems, the chart tracks essential physical attributes including volumetric weight, net mass, and gross weight to minimize shipping discrepancies.
- Streamlines parcel auditing and container loading efficiency.
- Facilitates accurate dimensional weight pricing for air and sea freight.
- Enhances inventory metadata for seamless e-commerce fulfillment.
Utilizing this data-driven framework allows businesses to refine distribution logistics and improve packaging optimization, ultimately reducing overhead costs while enhancing shipping accuracy and supply chain transparency.
Long-term Body Composition Trend Line
💾 Long-term Body Composition Trend Line .xls
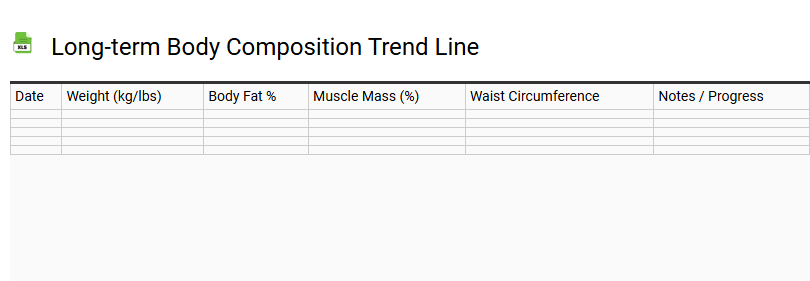
A long-term body composition trend line serves as a vital analytical tool for monitoring muscle mass gains and body fat percentage fluctuations over extended periods. Unlike daily scale weights influenced by hydration, this longitudinal approach visualizes genuine physiological changes and body recomposition progress. By plotting consistent biometric data, users can distinguish between temporary weight fluctuations and actual lean mass accrual or adipose tissue loss.
Integrating these fitness analytics into your fitness journey allows for precise plateau identification and informed nutritional adjustments. Mapping various data points against metabolic rate indicators helps optimize caloric intake and training intensity. Ultimately, tracking these biometric markers provides a comprehensive overview of hypertrophy and fat loss, ensuring sustainable health improvements through evidence-based progress tracking.
Body Measurement Milestone Tracker
💾 Body Measurement Milestone Tracker .xls
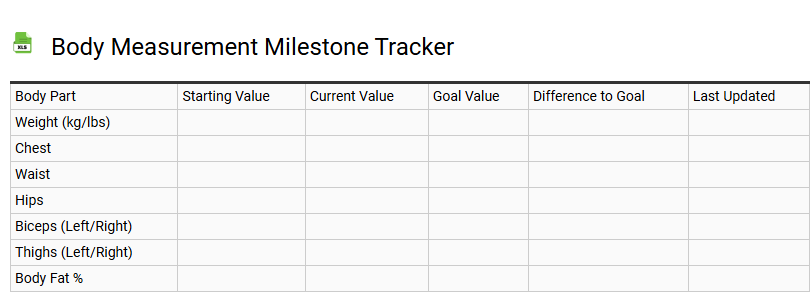
A body measurement milestone tracker is an essential tool for monitoring physical transformation and fitness progress beyond the scale. By documenting specific anthropometric data, users can visualize muscle hypertrophy and fat loss trends through consistent data entry. This comprehensive template facilitates the recording of key metrics such as waist circumference, chest width, hip measurements, and limb girth.
Utilizing a structured progress log helps in calculating the waist-to-hip ratio and tracking body composition changes over time. Key benefits of this tracking system include:
- Consistent Monitoring: Accurate oversight of bilateral symmetry and muscular development.
- Data-Driven Motivation: Tangible evidence of physical evolution during weight management cycles.
- Metric Accuracy: Standardized points of measurement ensure reliable longitudinal analysis.
Integrating this tracker into a wellness routine provides a holistic view of body recomposition, ensuring fitness milestones are met with precision and clarity.
This customizable fitness goal metric chart serves as a robust framework for progress tracking across various health parameters. By integrating workout data with activity logs, users can visualize strength gains and weight loss milestones effectively. This template enhances health performance monitoring through structured data visualization, ensuring a tailored approach to your personal fitness journey. In conclusion, this versatile tool is the ultimate resource for maintaining consistency and achieving long-term wellness success.