
Endometriosis Pain Intensity Map Template: Symptom Tracking Guide
Managing chronic pelvic pain requires precise tracking. An endometriosis pain intensity map serves as a vital visual log for documenting localized discomfort and symptom fluctuations throughout your menstrual cycle. By utilizing a standardized scale, patients can correlate flare-ups with specific activities or hormonal shifts. This diagnostic tool enhances communication with healthcare providers, ensuring accurate symptom management and personalized treatment adjustments. Consistent monitoring of radiating nerve pain or deep dyspareunia is essential for long-term clarity. Explore our expertly designed variations of templates below.
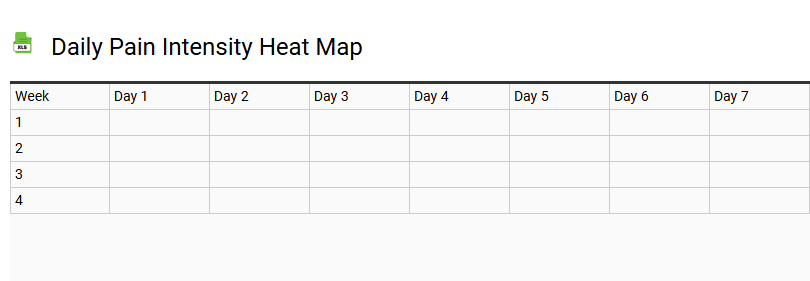
Daily Pain Intensity Heat Map
💾 Daily Pain Intensity Heat Map .xls
A Daily Pain Intensity Heat Map serves as a sophisticated tool for chronic pain management and proactive symptom tracking. By utilizing a intuitive color-coded scale, this template provides a clear visual representation of physical distress across various body regions over time. This method of data visualization allows users to identify longitudinal trends and pain patterns that might otherwise go unnoticed in traditional journals.
Integrating this health assessment into a daily wellness diary facilitates precise patient monitoring of intensity fluctuations and discomfort frequency. By recording severity levels systematically, individuals can provide healthcare providers with actionable insights during clinical consultations. This structured symptom documentation empowers patients to correlate environmental triggers with peak distress periods, ultimately optimizing personalized treatment plans through accurate, long-term health data analysis and comprehensive wellness tracking.
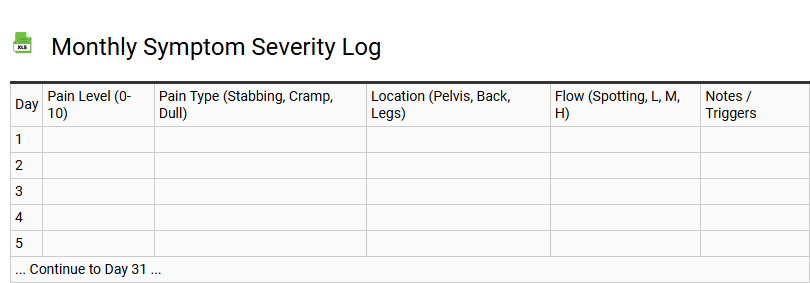
Monthly Symptom Severity Log
💾 Monthly Symptom Severity Log .xls
A monthly symptom severity log serves as a vital instrument for chronic pain management and proactive health tracking. By utilizing a standardized intensity scale (0-10), patients can systematically record daily fluctuations in physical discomfort, cognitive fatigue, or emotional well-being. This comprehensive medical diary facilitates precise pattern recognition, allowing users to identify specific environmental triggers and lifestyle factors that precede flare-ups.
- Monitor symptom progression over a consistent thirty-day cycle.
- Document the frequency and duration of recurring health episodes.
- Enhance wellness documentation for more accurate clinical assessments.
- Correlate medication efficacy with visible health trends.
Consistent daily monitoring transforms subjective experiences into objective clinical data. This structured health record empowers individuals during a physician consultation, ensuring that treatment adjustments are based on longitudinal evidence rather than intermittent memory, ultimately optimizing therapeutic outcomes and long-term recovery strategies.
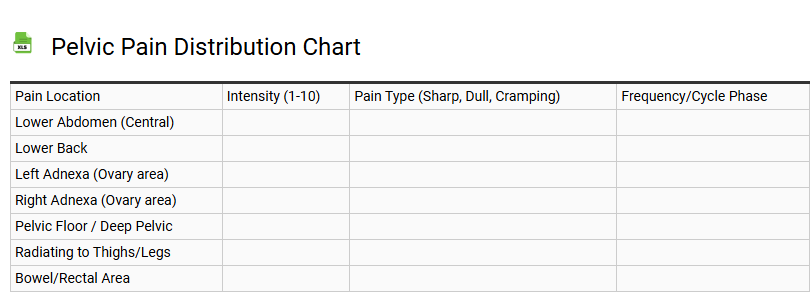
Pelvic Pain Distribution Chart
💾 Pelvic Pain Distribution Chart .xls
A pelvic pain distribution chart serves as a vital visual diagnostic tool designed to pinpoint the exact location and nature of discomfort within the lower abdominal and pelvic regions. This template allows individuals to document where sensations originate and how they migrate across the body, facilitating a clearer dialogue between patients and clinicians.
- Anatomical body maps covering anterior and posterior views for precise marking.
- Descriptive indicators to categorize sensations such as dull, sharp, or radiating.
- Intensity scales to track symptom severity over specific timeframes.
By consistently utilizing this resource, healthcare providers can identify patterns that may indicate specific underlying conditions. This structured approach improves the accuracy of clinical assessments and supports the development of targeted recovery strategies for both chronic and acute pelvic health issues.
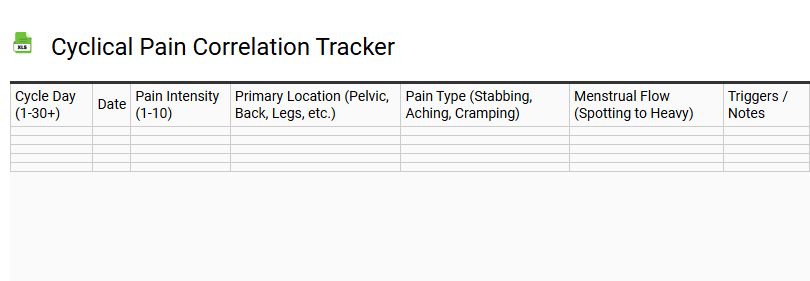
Cyclical Pain Correlation Tracker
💾 Cyclical Pain Correlation Tracker .xls
This Cyclical Pain Correlation Tracker serves as a sophisticated diagnostic tool for monitoring the interplay between hormonal fluctuations and physical discomfort. By utilizing this structured wellness diary, users can meticulously log symptom intensity alongside menstrual cycle phases, including ovulation and the luteal phase.
The template facilitates pattern recognition for chronic conditions such as endometriosis, migraine triggers, and fibromyalgia flare-ups. Mapping reproductive health data against inflammatory responses allows for precise data visualization of recurring health trends. This period logging framework empowers patients to provide healthcare providers with actionable biometric insights, optimizing pain management strategies. Use this symptom tracker to identify hormonal triggers and improve longitudinal health outcomes through consistent pelvic health monitoring and lifestyle adjustments based on empirical menstrual health data.
Endometriosis Flare-up Diary
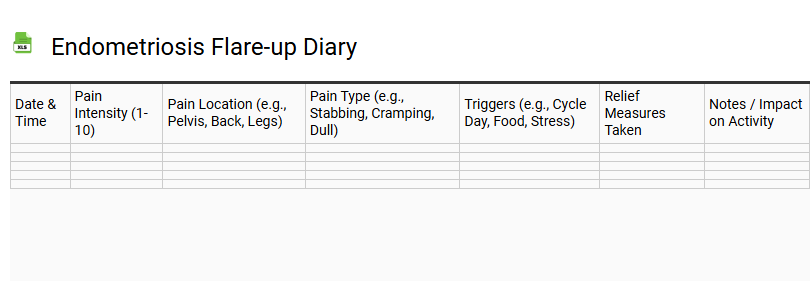
💾 Endometriosis Flare-up Diary .xls
Pain Scale and Location Map
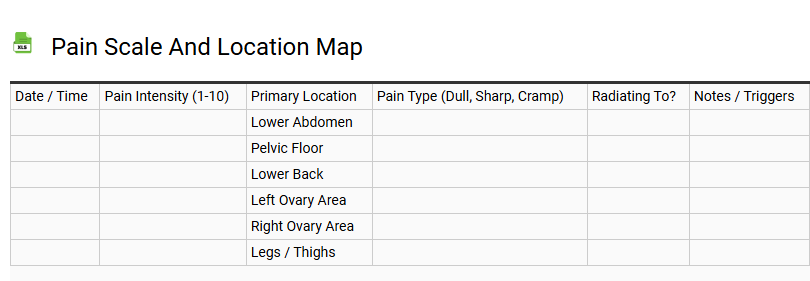
💾 Pain Scale and Location Map .xls
Utilizing a comprehensive pain scale and location map template streamlines clinical assessments and patient self-reporting. This essential diagnostic tool integrates a Visual Analog Scale (VAS) or numerical rating system to quantify pain intensity alongside a detailed anatomical body map for precise symptom tracking. Patients can accurately pinpoint localized discomfort, identify referred pain patterns, and describe sensory qualities such as radiating or throbbing sensations. For healthcare providers, these templates enhance medical documentation accuracy for chronic pain management and acute injury evaluation. By documenting the severity of discomfort and its exact physical distribution, clinicians can develop targeted treatment plans. This standardized assessment improves communication, ensures consistent monitoring of patient outcomes, and facilitates longitudinal data collection for physical therapy, neurology, or general medical intake processes.
Menstrual Cycle Pain Intensity Graph
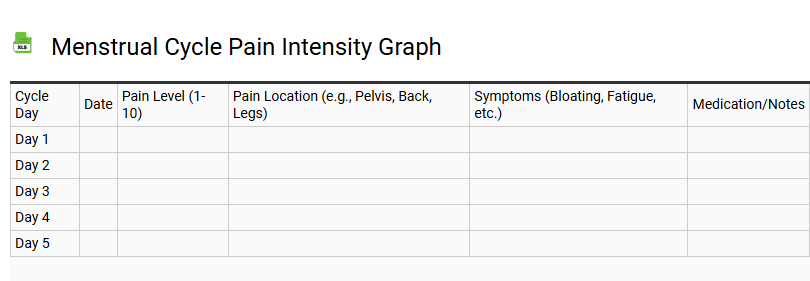
💾 Menstrual Cycle Pain Intensity Graph .xls
This menstrual cycle pain intensity graph serves as a sophisticated visual tool for monitoring pelvic discomfort and dysmenorrhea symptoms throughout the reproductive month. By plotting daily severity levels on a standardized scale, users can accurately map hormonal fluctuations against physical sensations. This tracking template is essential for identifying recurring patterns during the follicular phase, ovulation, and the luteal phase.
Utilizing data visualization for period cramps and menstrual wellness helps correlate symptom intensity with specific cycle days. Key benefits of this monitoring approach include:
- Identifying ovulatory pain and PMS triggers.
- Tracking cycle length and regularity.
- Providing objective data for reproductive health consultations.
By transforming a subjective symptom log into a structured graph, individuals gain actionable insights into their menstrual health, facilitating better diagnostic communication with healthcare providers.
Symptom and Trigger Log
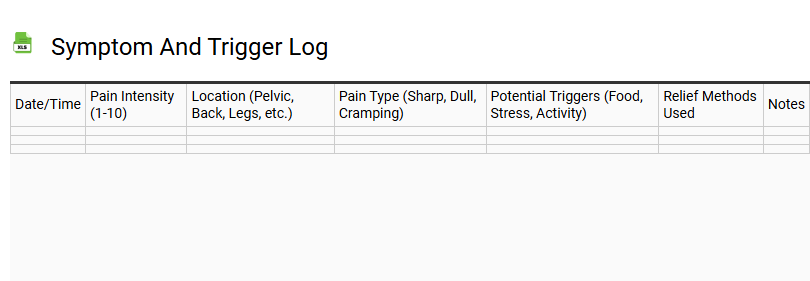
💾 Symptom and Trigger Log .xls
A comprehensive Symptom and Trigger Log serves as a vital health tracking tool for identifying correlations between daily activities and physical reactions. By maintaining a detailed medical diary, individuals can monitor chronic pain, fatigue, or allergic flare-ups with precision. This structured approach captures essential data points, including symptom severity, duration, and potential environmental triggers that influence well-being.
- Record dietary habits and nutritional intake to spot food sensitivities.
- Monitor sleep quality, stress levels, and physical activity.
- Document medication efficacy and potential side effects for clinical review.
Utilizing this wellness monitoring template facilitates data-driven insights, allowing healthcare providers to recognize emerging health patterns. Consistent self-tracking empowers patients to manage long-term conditions effectively while optimizing treatment plans through accurate, longitudinal health records and personal observation.
Chronic Pelvic Pain Trend Analysis
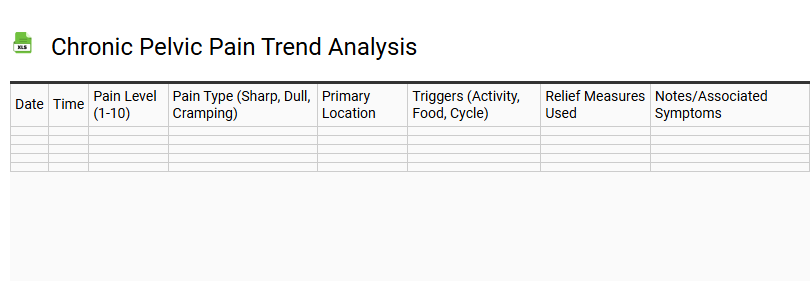
💾 Chronic Pelvic Pain Trend Analysis .xls
This chronic pelvic pain (CPP) trend analysis template serves as a robust longitudinal tool for monitoring symptom fluctuations and treatment efficacy. By documenting pain intensity via numerical rating scales, clinicians can identify cyclical patterns related to menstrual cycles, interstitial cystitis, or endometriosis flares. The template integrates essential metrics such as pelvic floor dysfunction markers, myofascial trigger point sensitivity, and nerve entrapment indicators to ensure comprehensive clinical mapping.
Users can track lifestyle triggers, including dietary habits, physical activity, and stress levels, providing a holistic view of the patient's quality of life. This data-driven approach facilitates multidisciplinary management strategies, allowing for real-time adjustments in pelvic physical therapy or pharmacological interventions. Utilizing this systematic framework ensures precise tracking of neuropathic pain and inflammatory responses, optimizing diagnostic accuracy and long-term health outcomes for those navigating persistent pelvic discomfort and reproductive health challenges.
Medication Efficacy and Pain Tracker
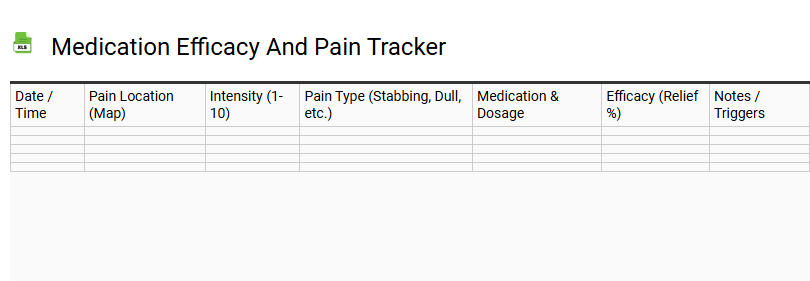
💾 Medication Efficacy and Pain Tracker .xls
A medication efficacy and pain tracker serves as a vital clinical tool for systematic symptom monitoring and evaluating therapeutic outcomes. By documenting dosage administration alongside real-time analgesic effectiveness, patients can visualize their pharmacological response to specific treatments. This template facilitates the recording of pain intensity scales, flare-up triggers, and potential adverse side effects, ensuring a comprehensive health log of patient-reported outcomes.
Utilizing such a structured health progress diary enhances treatment adherence and assists healthcare providers in refining chronic pain management protocols. Precise data logging of wellness metrics allows for a deeper understanding of physiological reactions, fostering informed clinical decisions. Whether managing long-term ailments or post-operative recovery, consistent medication tracking optimizes quality of care through rigorous self-reporting and data-driven health insights into patient wellness and recovery trajectories.
Physical Activity and Pain Impact Log
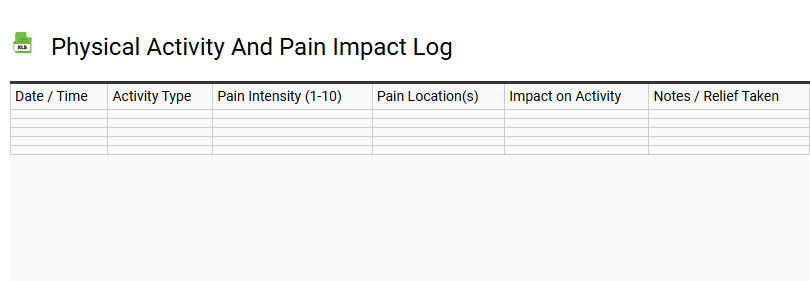
💾 Physical Activity and Pain Impact Log .xls
This Physical Activity and Pain Impact Log serves as a vital diagnostic tool for monitoring the correlation between exercise intensity and symptom management. By documenting daily movement patterns, range of motion, and perceived exertion, individuals can identify specific triggers for chronic pain flare-ups or improvements in functional mobility.
Utilizing this structured wellness journal helps track pain levels using a standardized intensity scale, providing essential data for physical therapists and rehabilitation specialists. Recording active recovery sessions and physiological responses aids in overcoming kinesiophobia while enhancing active living strategies. This systematic approach to symptom tracking ensures a data-driven path toward injury prevention and optimized musculoskeletal health, allowing for precise adjustments in exercise dosage and recovery protocols to improve overall quality of life.
Gastrointestinal Symptom Pain Map
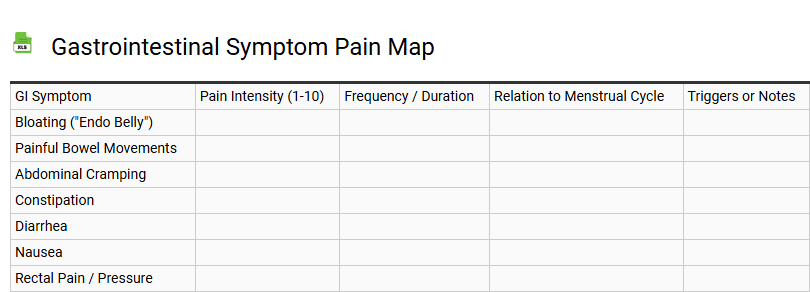
💾 Gastrointestinal Symptom Pain Map .xls
A Gastrointestinal Symptom Pain Map serves as a vital diagnostic tool for visualizing abdominal discomfort and visceral sensations. By utilizing specific anatomical landmarks, this template allows patients to precisely locate epigastric distress, localized cramping, or radiating pain across the abdominal quadrants. Clinical utility includes:
- Diagnostic Precision: Identifies triggers for dyspepsia, bloating, and irregular bowel habits.
- Symptom Tracking: Documents pain intensity and referred pain patterns essential for evaluating irritable bowel syndrome (IBS), gastritis, or inflammatory bowel disease.
- Clinical Assessment: Enhances communication between patients and providers regarding digestive health and gastrointestinal motility.
This structured mapping approach ensures comprehensive monitoring of chronic inflammation and malabsorption issues, facilitating targeted treatment plans for optimal digestive wellness and effective symptom management.
Ovulation Pain Intensity Tracker
💾 Ovulation Pain Intensity Tracker .xls
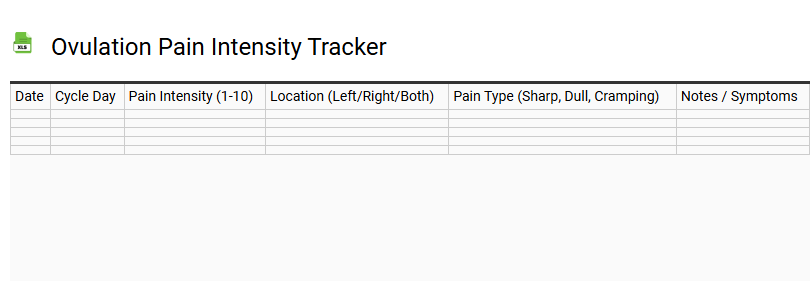
This ovulation pain intensity tracker serves as a specialized tool for monitoring reproductive health and pinpointing your fertile window. By logging monthly pelvic discomfort, commonly known as mittelschmerz, users can identify patterns in their menstrual cycle. This template allows you to quantify the severity of sharp twinges or dull aches typically localized in the lower abdomen during the mid-cycle phase.
Tracking these symptoms alongside hormonal shifts provides data on ovarian follicle activity and the luteinizing hormone (LH) surge. Consistent documentation helps differentiate between normal physiological sensations and irregular gynecological symptoms. By recording pain duration and intensity, you enhance your understanding of follicular and luteal phases. This symptom diary acts as a comprehensive resource for optimizing fertility awareness and improving communication with healthcare providers regarding menstrual regularity and overall reproductive well-being.
Surgery Recovery Pain Log
💾 Surgery Recovery Pain Log .xls
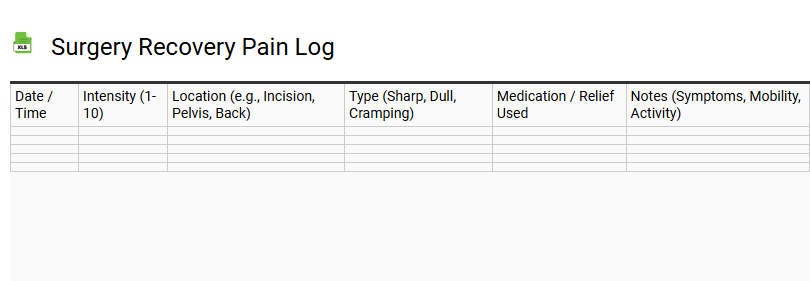
Utilizing a structured surgery recovery pain log is essential for monitoring post-operative progress and ensuring optimal patient outcomes. This clinical tracking tool allows patients to systematically document pain intensity using a standardized numeric scale, alongside precise medication administration timestamps. By recording analgesic efficacy and identifying patterns of breakthrough pain, individuals provide healthcare providers with vital data during surgical follow-up consultations.
An effective log should capture several critical metrics:
- Incision site appearance and signs of localized inflammation.
- Exact dosage and frequency of prescribed pain management protocols.
- Mobility levels and their correlation with symptom fluctuations.
- Potential side effects related to anesthesia or pharmacological interventions.
Maintaining this recovery journal facilitates early detection of complications, streamlining the rehabilitation phase and enhancing wound care transparency for the medical team.
Sleep Quality and Pain Level Correlation Matrix
💾 Sleep Quality and Pain Level Correlation Matrix .xls
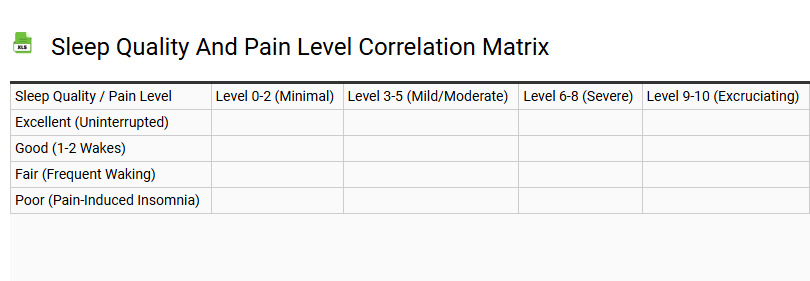
This analytical framework evaluates the complex interplay between restorative rest and physical discomfort. By systematically documenting daily metrics, the matrix reveals how sleep duration and depth directly influence perceived pain intensity. This data-driven approach assists in identifying cyclical patterns where poor rest may heighten sensory sensitivity or where acute discomfort disrupts sleep architecture.
- Restorative Metrics: Captures essential data regarding sleep efficiency, onset latency, and overall disturbances.
- Intensity Tracking: Records fluctuations in physical discomfort using standardized scales to ensure longitudinal accuracy.
- Pattern Recognition: Highlights correlations that inform more effective management strategies and lifestyle adjustments.
Utilizing this structured template facilitates clearer communication with healthcare professionals. It transforms subjective experiences into objective observations, allowing for the optimization of therapeutic interventions and the improvement of overall well-being through targeted adjustments to sleep hygiene and pain protocols.
Utilizing a comprehensive endometriosis pain intensity map serves as a vital diagnostic aid for monitoring chronic pelvic pain and cyclical flare-ups. This visual tracking tool enables patients to document anatomical discomfort and symptom severity across their menstrual cycle. By systematically recording localized sensations, individuals provide healthcare specialists with precise data to optimize treatment strategies. This tracking template empowers patients to bridge communication gaps during consultations, ensuring better management of gynecological health and improved quality of life through accurate, data-driven self-reporting.