
Fertility Awareness Method (FAM) Log Template
Mastering your reproductive health begins with a structured Fertility Awareness Method (FAM) log. Tracking daily Basal Body Temperature (BBT), cervical mucus consistency, and other symptomatic markers is essential for identifying your ovulation window and understanding menstrual cycle fluctuations. A well-designed charting template simplifies monitoring hormonal patterns for either natural family planning or conception goals. Using these precise tools empowers you to visualize biological data accurately and gain deeper cycle insights. Please check the already made variation of templates below.
Basal Body Temperature Chart
💾 Basal Body Temperature Chart .xls
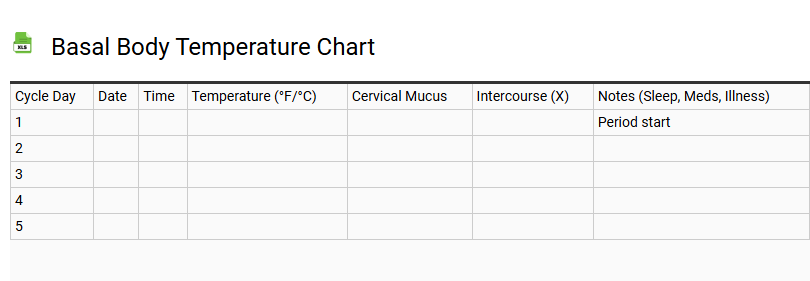
A Basal Body Temperature (BBT) chart template serves as a vital instrument for monitoring the menstrual cycle and accurately predicting ovulation. By recording your daily waking temperature using a high-precision basal thermometer, you can identify the thermal shift triggered by increased progesterone levels. This fertility awareness method (FAM) allows users to distinguish between the follicular phase and the luteal phase, typically revealing a biphasic pattern indicative of a healthy ovulatory cycle.
Utilizing a structured tracking log to document cervical mucus consistency alongside temperature readings improves the precision of identifying the fertile window. Whether your goal is conception or proactive reproductive health monitoring, a consistent BBT graph provides evidence-based insights into hormonal fluctuations and potential luteal phase irregularities, ensuring comprehensive fertility tracking through reliable biometric data.
Cervical Mucus Tracker
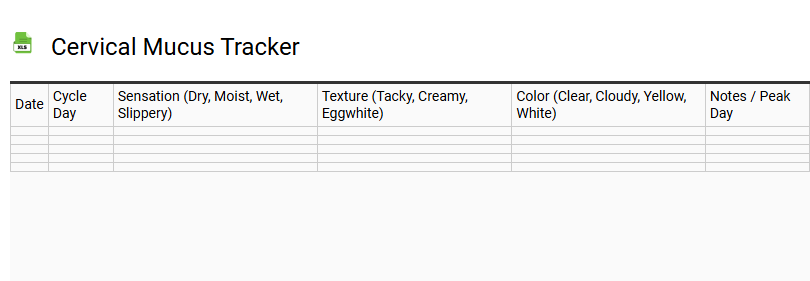
A cervical mucus tracker is a vital tool for mastering the fertility awareness method (FAM) and optimizing reproductive health. By documenting daily changes in vaginal discharge throughout your menstrual cycle, you can accurately pinpoint your fertile window and predict ovulation.
This template helps users log transitions from dry or sticky sensations to the highly fertile egg white cervical mucus (EWCM) characteristic of peak estrogen levels. Consistent tracking during the follicular phase assists in identifying the most viable days for conception. Integrating this data with basal body temperature (BBT) readings provides a comprehensive view of hormonal fluctuations and luteal phase health. Using a structured log ensures precise monitoring of cervical fluid consistency, empowering individuals to understand their unique biological rhythms and improve natural family planning outcomes.
Symptothermal Method Log
💾 Symptothermal Method Log .xls
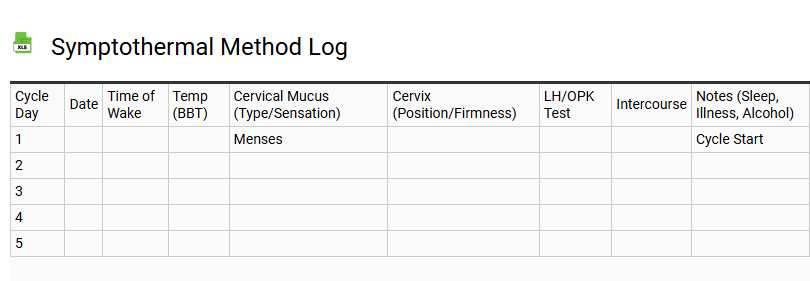
A comprehensive Symptothermal Method Log serves as a vital tool for tracking reproductive health and identifying the fertile window. By recording daily Basal Body Temperature (BBT) and observing shifts in cervical mucus consistency, users can accurately pinpoint ovulation. This template facilitates the integration of secondary fertility signs, such as cervical position and hormonal fluctuations across the follicular and luteal phases.
Utilizing this structured approach to Fertility Awareness-Based Methods (FABM) allows for precise monitoring of the menstrual cycle. Key charting features include:
- Tracking thermal shifts to confirm the post-ovulatory state.
- Documenting fluid patterns to identify the peak day.
- Analyzing cycle variability for natural family planning (NFP).
Effective charting empowers individuals with biological insights, enhancing efficacy for those seeking to achieve or avoid pregnancy through data-driven biomarker observation and cross-checking techniques.
Cycle Length History
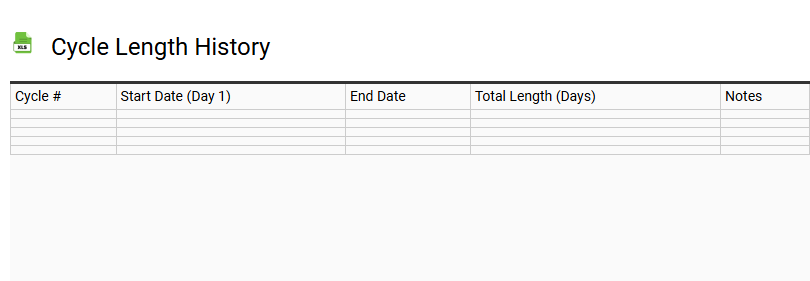
A cycle length history serves as a comprehensive log for monitoring reproductive health and hormonal balance. By documenting the interval between the first day of menses and the start of the next period, individuals can identify menstrual patterns and cycle consistency. This data provides crucial insights into the follicular phase and luteal phase, helping to pinpoint the ovulation window and fertile days.
Consistently tracking period duration through a dedicated template allows for the early detection of irregularities or hormonal fluctuations. Maintaining this health data is essential for evaluating menstrual wellness and optimizing fertility tracking. Whether used for family planning or gynecological health monitoring, a detailed history transforms raw dates into actionable wellness trends, offering a clear view of your body's biological rhythm and overall endocrine function.
Ovulation Prediction Calculator
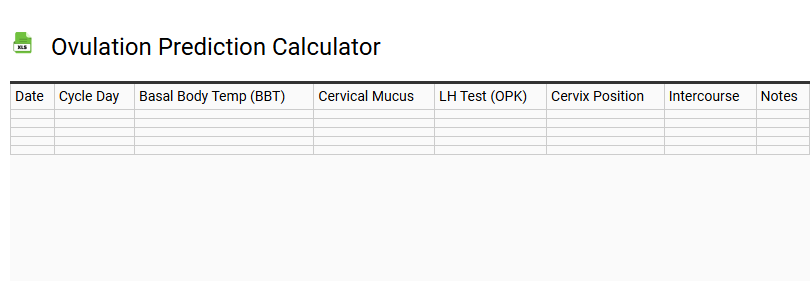
💾 Ovulation Prediction Calculator .xls
An ovulation prediction calculator is a sophisticated digital tool designed to help individuals track their menstrual cycle and identify their fertile window. By analyzing the date of your last period and average cycle length, this tool estimates the luteal phase and the timing of the LH surge, which precedes the release of an egg.
Pinpointing these peak fertility days is essential for conception. Users can further refine accuracy by monitoring basal body temperature and changes in cervical mucus. This comprehensive approach to reproductive health monitors the follicular phase and calculates the optimal conception window. Whether you are practicing natural family planning or trying to conceive, understanding these biological rhythms and hormonal health patterns ensures you can accurately predict your most fertile days each month.
Billings Method Sheet
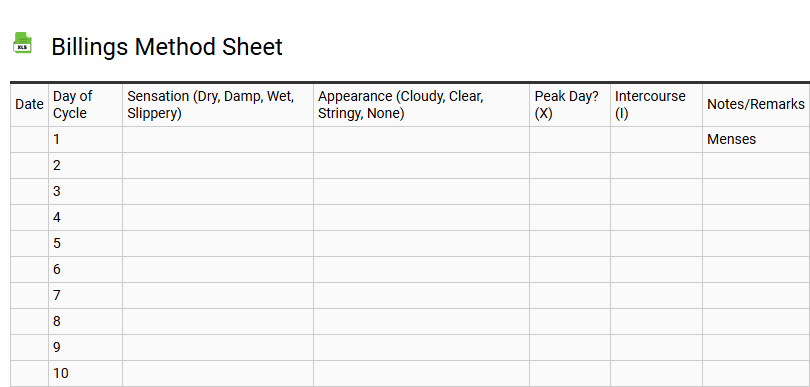
A Billings Method sheet serves as a vital tool for natural family planning and fertility awareness. This specialized tracking chart allows individuals to record daily observations of cervical mucus and vulvar sensations. By documenting the progression from dry days to the peak day, users can accurately identify their fertile window and monitor hormonal shifts throughout the menstrual cycle.
Utilizing a standardized charting template ensures precision in reproductive health monitoring, helping to pinpoint ovulation without invasive testing. Consistent logging of mucus appearance and sensation patterns supports both pregnancy achievement and natural avoidance. This evidence-based approach to fertility management relies on biological markers to interpret the body's natural rhythms. Whether using color-coded stamps or descriptive notations, maintaining a detailed tracking sheet is essential for achieving high efficacy and reproductive health literacy.
Marquette Method Log
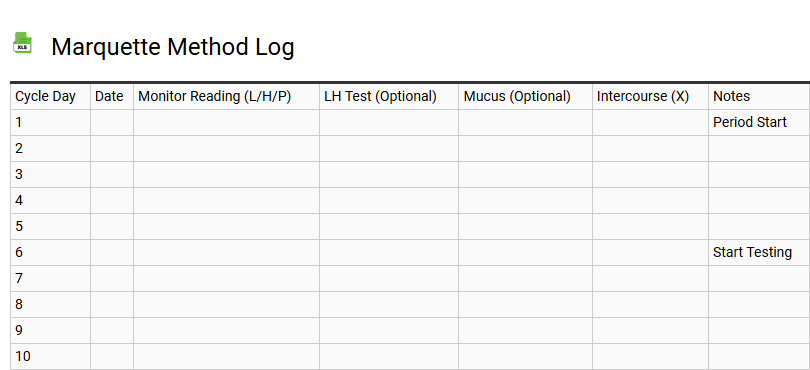
This Marquette Method Log template provides a streamlined framework for practicing Natural Family Planning (NFP) with precision. By integrating data from the Clearblue Easy Fertility Monitor, users can objectively track urinary hormones, specifically estrogen and luteinizing hormone (LH) metabolites.
The log is designed to document daily fertility status-categorized as low, high, or peak-to accurately identify the fertile window and ovulation. This evidence-based cycle tracking tool is particularly effective for those navigating complex life stages, such as postpartum breastfeeding or perimenopause.
- Monitor hormonal trends for improved reproductive health insights.
- Standardize fertility awareness protocols to reduce user error.
- Record biomarkers alongside monitor readings for comprehensive menstrual charting.
Utilizing this structured template ensures consistent data visualization of your cycle, supporting informed family planning through objective, algorithm-based methodology.
Hormonal Balance Tracker
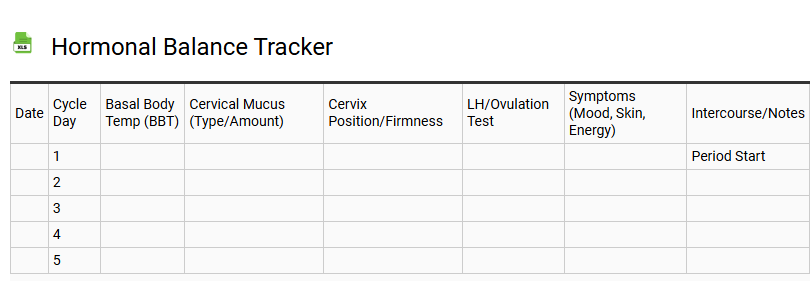
💾 Hormonal Balance Tracker .xls
This hormonal balance tracker serves as a comprehensive digital tool for monitoring endocrine health and daily cyclical fluctuations. By utilizing this structured template, users can engage in precise symptom tracking, recording essential bio-markers such as energy levels, sleep quality, and mood stability.
The log facilitates a deeper understanding of the menstrual cycle, helping to identify ovulation windows and the luteal phase. Monitoring shifts in estrogen, progesterone, and cortisol levels provides actionable insights into metabolic function and reproductive wellness.
Designed as a holistic wellness journal, it encourages the documentation of basal body temperature, thyroid health indicators, and nutritional triggers. Consistent data entry empowers individuals to visualize biological rhythms, effectively managing PMS symptoms and adrenal fatigue while optimizing long-term hormonal harmony and vitality.
Fertility Window Calendar
💾 Fertility Window Calendar .xls
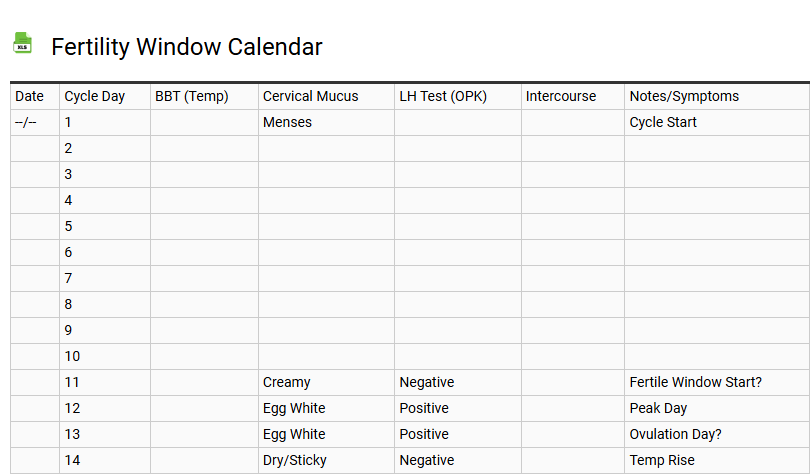
A fertility window calendar serves as a vital roadmap for individuals navigating pregnancy planning and reproductive health. By meticulously tracking the menstrual cycle, this template helps identify the ovulation cycle and the specific days of peak fertility. Utilizing markers such as basal body temperature shifts and changes in cervical mucus, the calendar pinpoints the follicular phase and the subsequent luteal phase.
Effective tracking apps and manual templates allow users to record hormonal changes, ensuring a precise understanding of their fertile days. This data-driven approach maximizes the chances of conception by highlighting the six-day interval when an egg is most viable. Whether for natural family planning or assisted reproduction, a well-maintained ovulation tracker transforms complex biological signals into an actionable schedule for prospective parents.
Daily Health and Mood Log
💾 Daily Health and Mood Log .xls
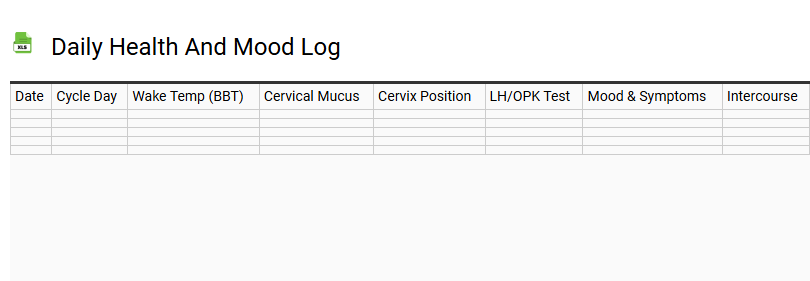
Utilizing a daily health and mood log serves as a comprehensive wellness journal to track the intricate connection between physical symptoms and emotional well-being. This structured template empowers users to monitor critical biometric data, such as sleep quality and hydration levels, alongside fluctuating energy levels and mental clarity.
- Identify specific triggers affecting stress management and psychological resilience.
- Track nutritional intake and physical activity for holistic health insights.
- Document daily reflections to observe longitudinal trends in mood stability.
- Correlate dietary habits with digestive health and overall vitality.
By maintaining a consistent habit tracker, individuals gain actionable insights into their personal health baseline. This proactive self-monitoring facilitates informed lifestyle adjustments and improves communication with healthcare providers, bridging the gap between subjective feelings and objective health metrics for optimized long-term wellness outcomes.
LH Surge Testing Log
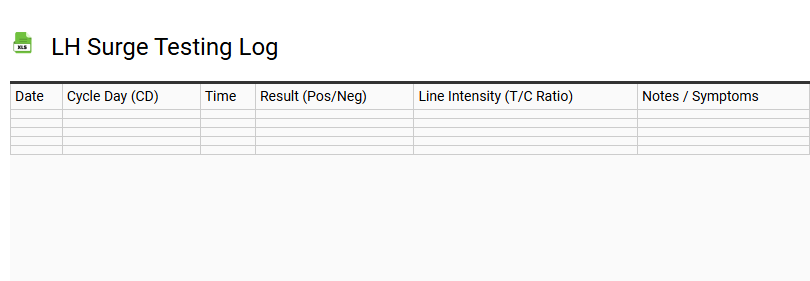
An LH surge testing log serves as a critical monitoring tool for tracking luteinizing hormone fluctuations throughout the menstrual cycle. By meticulously recording results from ovulation predictor kits (OPKs), users can accurately identify their fertile window and the specific onset of peak fertility. This structured documentation typically tracks the cycle day, testing timestamp, and test line intensity relative to the control line or digital indicators.
Utilizing a log helps pinpoint the hormonal surge that precedes ovulation, usually occurring 24 to 36 hours before egg release. Monitoring these endocrine biomarkers assists in timing intercourse or insemination for conception. Maintaining a consistent record reveals ovulatory patterns and provides valuable reproductive health data for medical consultations, ensuring a comprehensive overview of follicular phase progression and cycle regularity.
Creighton Model Charting Sheet
💾 Creighton Model Charting Sheet .xls
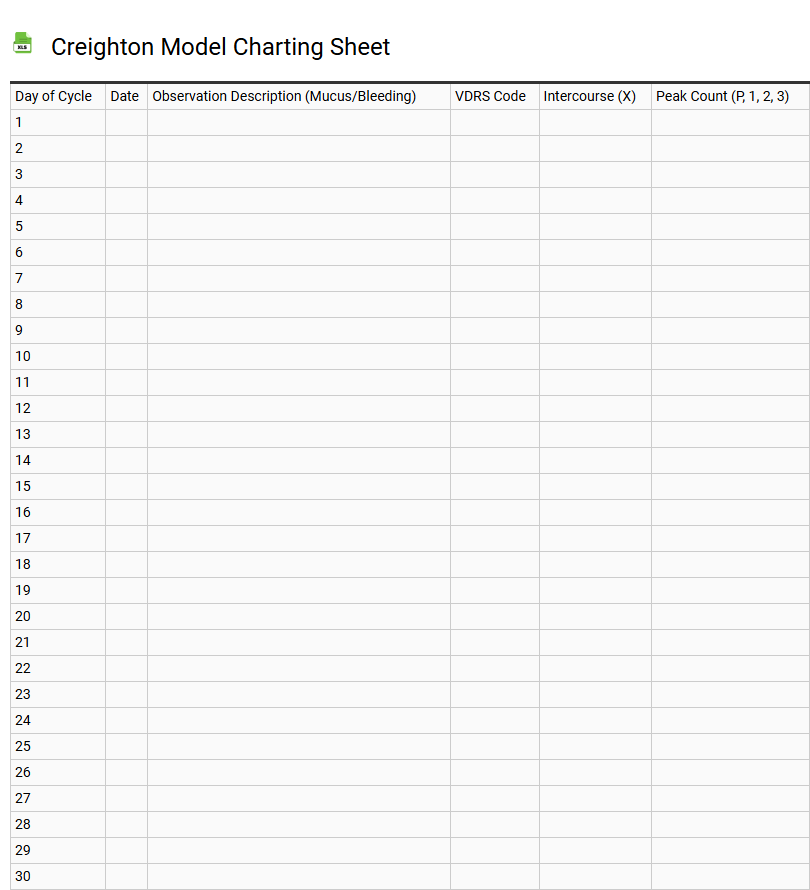
A Creighton Model Charting Sheet is a specialized instrument used within the Creighton Model FertilityCare System (CrMS) to monitor reproductive health and fertility biomarkers. This standardized template facilitates the precise recording of cervical mucus observations, menstrual flow, and vaginal discharge patterns. By applying specific charting symbols-including red, green, and white stamps-users can accurately identify the peak day, signaling ovulation and the transition from the follicular to the luteal phase.
Consistent use of this fertility tracking tool supports NaProTechnology medical interventions by highlighting hormonal imbalances or cycle irregularities. Whether utilizing a digital interface or a physical paper log, the grid-based format ensures systematic documentation of biological markers. Effective charting empowers individuals to understand their unique menstrual cycle, providing essential data for both natural family planning and diagnostic reproductive medicine.
Period and Flow Intensity Tracker
💾 Period and Flow Intensity Tracker .xls
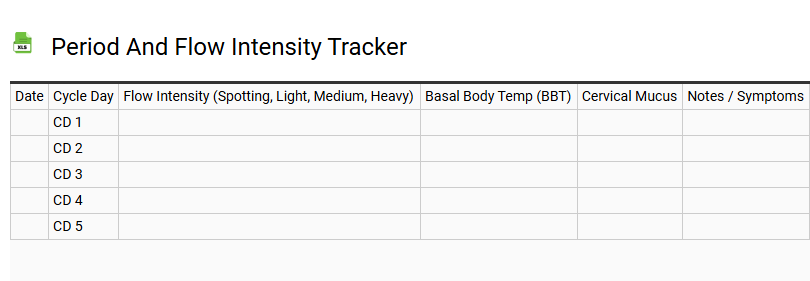
A Period and Flow Intensity Tracker provides a structured digital framework to monitor menstrual health and cycle regularity. This tool enables users to record the precise start and end dates of their cycles, helping to establish personal baselines and identify recurring patterns. By documenting daily variations, individuals gain a clearer understanding of their biological rhythms.
This template facilitates the detailed logging of essential health data, including:
- Flow Volume: Categorize intensity from light spotting to heavy levels.
- Symptom Management: Note physical changes such as cramps, bloating, or energy fluctuations.
- Cycle Trends: Calculate the average length of cycles to improve future predictions.
Maintaining a consistent record assists in identifying irregularities early and provides clear data for healthcare consultations. The organized layout ensures that all vital health information is easily accessible, supporting proactive wellness management and better hormonal awareness.
Basal Body Temperature Graphing Tool
💾 Basal Body Temperature Graphing Tool .xls
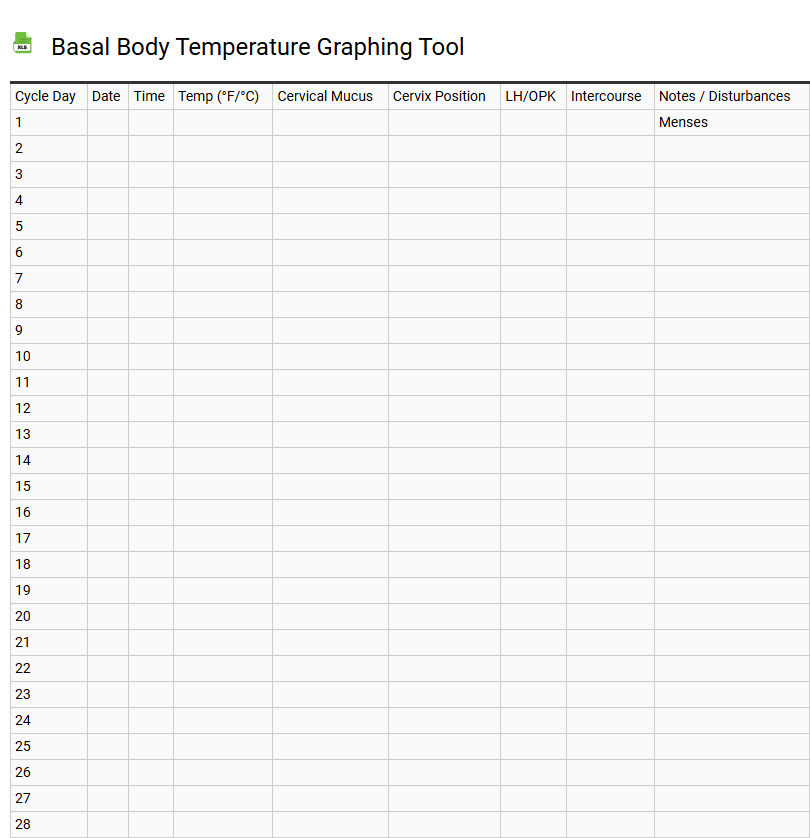
This Basal Body Temperature (BBT) graphing tool provides a comprehensive digital fertility chart for precise ovulation tracking. By recording your daily waking temperature with a digital basal thermometer, you can visualize the biphasic pattern essential for identifying your fertile window. This template monitors the thermal shift triggered by progesterone, helping users distinguish between the follicular phase and the luteal phase of the menstrual cycle.
Optimized for natural family planning and conception, the tool allows you to log biometric data to predict peak fertility. Integrating sympto-thermal method principles, it tracks hormonal fluctuations to confirm ovulation has occurred. Whether managing reproductive health or seeking pregnancy, this menstrual cycle tracking interface offers clear insights into your biological rhythms and fertility awareness markers.
Post-Ovulation Phase Length Log
💾 Post-Ovulation Phase Length Log .xls
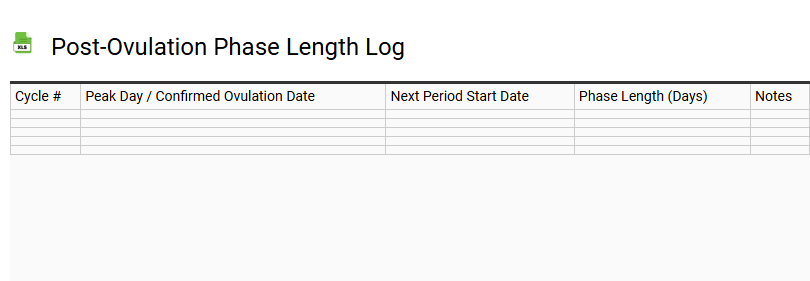
Monitoring your luteal phase length is essential for assessing reproductive health and hormonal balance. This Post-Ovulation Phase Length Log tracks the specific interval between ovulation confirmation and the onset of your next menstrual cycle. By recording Basal Body Temperature (BBT) shifts and changes in cervical mucus, users can pinpoint when the corpus luteum begins secreting progesterone.
Tracking this post-ovulatory interval is vital for identifying the implantation window and potential Luteal Phase Defects (LPD). Consistent logging provides data on:
- Hormonal stability and uterine lining readiness.
- Accurate period prediction based on individual cycle history.
- Detection of ovulatory dysfunction or short cycles.
Utilizing this template enhances fertility awareness, offering vital insights for those tracking conception windows or monitoring reproductive endocrine health with precise, actionable data to share with healthcare providers.
This guide explores a versatile Fertility Awareness Method log, empowering users to track basal body temperature, cervical mucus, and menstrual cycle phases. By documenting these biological markers, you gain insights into hormonal patterns and ovulation timing. Whether used for natural family planning or monitoring reproductive health, this cycle charting template simplifies daily data collection. In conclusion, utilizing a structured log helps identify your fertile window with confidence. Download our template to master your body's signals and achieve greater cycle literacy today.