
Heart Rate Zone Journal Template for Training Intensity Tracking
Optimizing cardiovascular performance requires precise monitoring of physiological intensity during exercise. Utilizing a dedicated heart rate zone journal allows fitness enthusiasts to track aerobic capacity, fat-burning efficiency, and peak exertion levels systematically. By documenting resting pulses and recovery intervals, you can tailor your endurance training to meet specific health milestones. This data-driven approach ensures every workout aligns with your target heart rate objectives for maximum efficiency. Please check an already made variation of templates below.
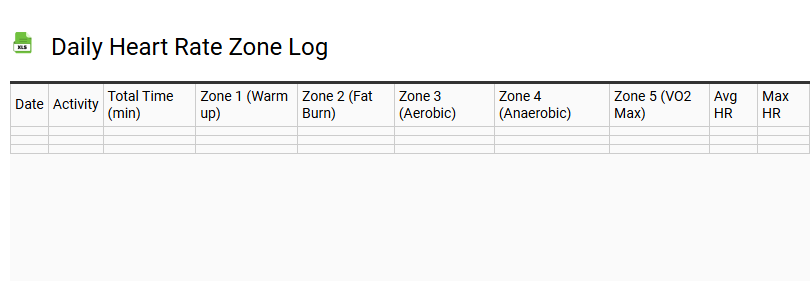
Daily Heart Rate Zone Log
💾 Daily Heart Rate Zone Log .xls
A daily heart rate zone log serves as a vital tool for tracking cardiovascular exertion and recovery patterns. By documenting time spent in specific intensity brackets, individuals can visualize their fitness progression and optimize physical output.
This tracking system typically categorizes activity into several key areas to provide a comprehensive overview of physiological stress:
- Warm-up: Low-intensity movement to prepare the body for exertion.
- Fat Burn: Moderate intensity levels that build steady endurance.
- Aerobic: Challenging paces designed to improve lung and heart capacity.
- Anaerobic: High-intensity efforts that increase strength and speed.
- Peak: Maximum effort intervals for short durations.
Consistent recording helps prevent overtraining and ensures that every session aligns with specific health objectives. By reviewing these metrics regularly, users can adjust their routines to maintain a balanced approach to long-term wellness and athletic performance.
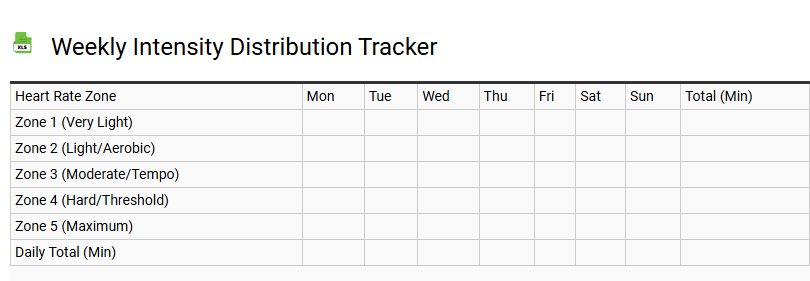
Weekly Intensity Distribution Tracker
💾 Weekly Intensity Distribution Tracker .xls
A Weekly Intensity Distribution Tracker is a specialized tool designed for athletes to monitor their training load and ensure optimal periodization. By systematically logging heart rate zones and RPE (Rate of Perceived Exertion), this template visualizes the balance between low-intensity base work and high-intensity intervals.
Utilizing this data allows for a polarized training approach, effectively managing volume across specific intensity domains. Tracking these performance metrics is crucial for preventing overtraining while enhancing aerobic capacity and anaerobic threshold. This strategic overview helps athletes adjust their power output and prioritize athletic recovery, ensuring every workout aligns with long-term fitness goals. Whether focusing on endurance or speed, maintaining a clear intensity log provides the data-driven insights necessary for consistent progress and peak physiological adaptation throughout the competitive season.
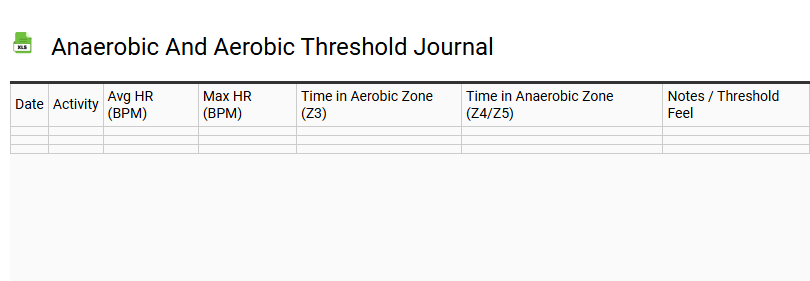
Anaerobic and Aerobic Threshold Journal
💾 Anaerobic and Aerobic Threshold Journal .xls
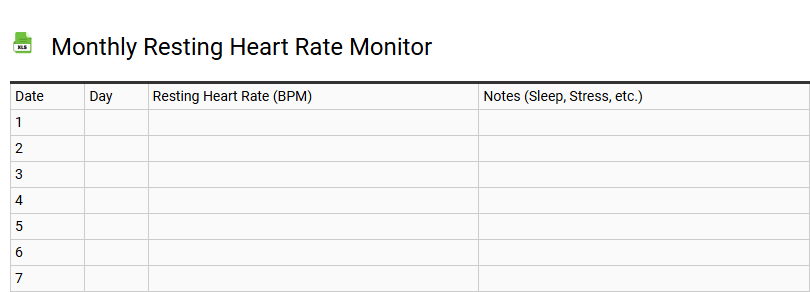
Monthly Resting Heart Rate Monitor
💾 Monthly Resting Heart Rate Monitor .xls
A Monthly Resting Heart Rate Monitor serves as a vital diagnostic tool for tracking long-term cardiovascular health. By consistently logging your baseline pulse in beats per minute (BPM) immediately upon waking, users establish a clear physiological profile. This template facilitates the identification of heart rate variability trends and fluctuations influenced by aerobic conditioning, stress levels, and recovery cycles.
Monitoring these biometric data points helps detect early signs of overtraining or systemic fatigue by observing deviations from your normal sinus rhythm. Utilizing a structured log ensures accurate data visualization of your autonomic nervous system response. Key metrics included in this tracking system are:
- Daily RHR measurements for consistency
- Monthly BPM averages to identify fitness gains
- Correlations between sleep quality and heart health
- Recovery status indicators for peak performance
Consistent tracking empowers proactive wellness management and optimizes physical health through precise health metric analysis.
Zone 2 Endurance Training Log
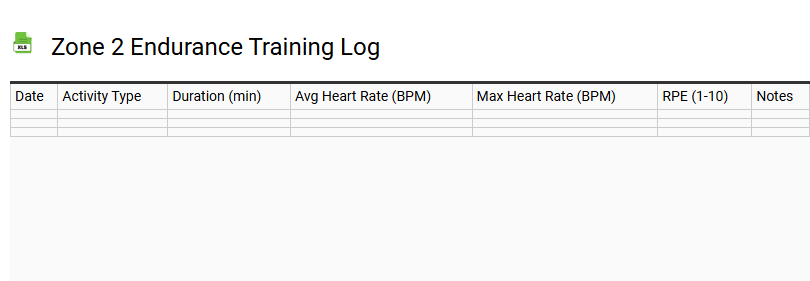
💾 Zone 2 Endurance Training Log .xls
A Zone 2 Endurance Training Log is an essential instrument for athletes focused on aerobic base building and metabolic efficiency. This structured template monitors low-intensity steady-state (LISS) sessions where heart rate typically remains between 60% and 70% of maximum capacity. By consistently documenting average heart rate, duration, and Rate of Perceived Exertion (RPE), endurance athletes can ensure they stay within the fat-oxidation window while avoiding the lactate threshold.
- Track mitochondrial density improvements through steady-state volume.
- Monitor cardiovascular drift during prolonged aerobic capacity workouts.
- Evaluate recovery metrics to optimize physiological adaptation and stamina.
Utilizing a dedicated log helps maintain the "conversational pace" necessary for metabolic flexibility. This disciplined approach to fitness tracking prevents overtraining and builds a robust foundation for future high-intensity intervals, ultimately enhancing long-term athletic performance and systemic fat metabolism.
Interval Session Heart Rate Summary
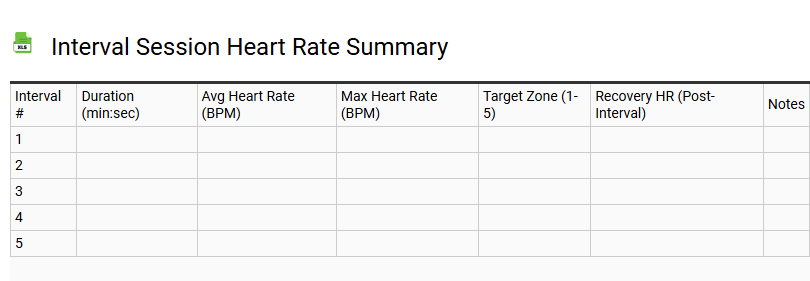
💾 Interval Session Heart Rate Summary .xls
This report provides a concise overview of cardiovascular performance during high-intensity interval training. By tracking average heart rate and peak beats per minute, athletes can accurately assess the physiological demands of each work period.
- Work Intervals: Measures the maximum exertion levels reached during high-effort phases to ensure the target intensity is met.
- Recovery Phases: Analyzes the speed at which the heart rate drops during rest, serving as a vital indicator of cardiovascular efficiency and fitness progression.
- Zone Distribution: Breaks down the total time spent in anaerobic and aerobic thresholds to validate the training stimulus.
Consistently monitoring these metrics helps in refining training loads, preventing overtraining, and optimizing endurance gains for future sessions.
Heart Rate Zone Calculator and Mapping Tool
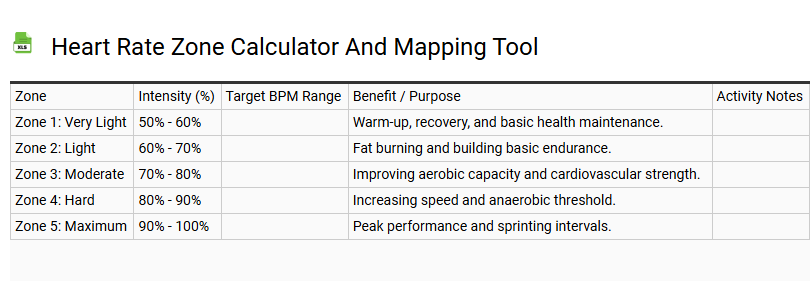
💾 Heart Rate Zone Calculator and Mapping Tool .xls
Optimize your cardiovascular fitness using this precise Heart Rate Zone Calculator. By analyzing your Maximum Heart Rate (MHR) and Resting Heart Rate (RHR), this mapping tool calculates personalized training intensities through the Karvonen formula. Identify your optimal fat-burning zone, aerobic capacity, and anaerobic threshold to streamline your endurance training and improve metabolic efficiency.
Understanding these specific intensity zones is crucial for increasing VO2 max and managing recovery times. Whether you are focused on steady-state cardio or high-intensity interval training (HIIT), tracking biometric data ensures you remain within safe physiological limits. This tool helps athletes monitor their lactic threshold and cardiac output, preventing overtraining while enhancing overall athletic performance and cardiovascular health through data-driven, customized exercise programming tailored to individual fitness levels.
Post-Workout Heart Rate Recovery Tracker
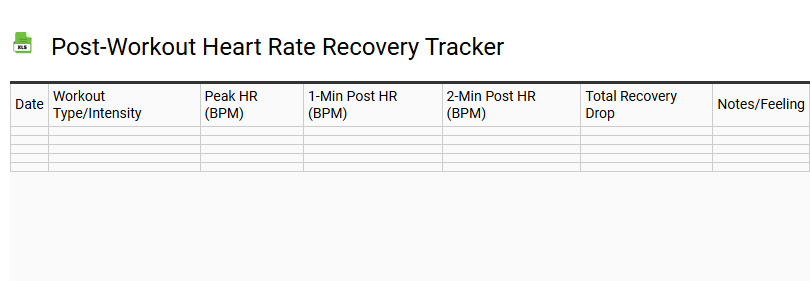
💾 Post-Workout Heart Rate Recovery Tracker .xls
This post-workout heart rate recovery tracker serves as a critical diagnostic tool for measuring cardiovascular fitness and aerobic capacity. By documenting the reduction in beats per minute (BPM) immediately following physical exertion, users can evaluate their parasympathetic nervous system reactivation and vagal tone. A rapid heart rate recovery (HRR) is a primary indicator of a healthy cardiac output and efficient metabolic recovery.
Utilize this template to log your peak heart rate at the end of a training session and compare it against your resting pulse after a one-to-two-minute cool-down period. Consistent tracking of these biometric data points helps identify fitness progression, prevents overtraining syndrome, and optimizes athletic performance. Monitoring these vital signs provides actionable insights into your cardiovascular health, allowing for data-driven adjustments to exercise intensity and rest intervals for long-term wellness.
Cardiovascular Efficiency Progress Sheet
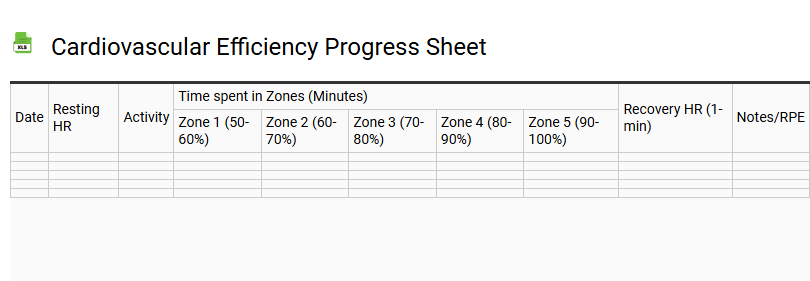
💾 Cardiovascular Efficiency Progress Sheet .xls
This cardiovascular efficiency progress sheet serves as a vital diagnostic tool for monitoring aerobic capacity and long-term heart health. By systematically tracking metrics such as resting heart rate, recovery intervals, and blood pressure fluctuations, individuals can quantify improvements in their circulatory system.
Utilizing this template allows for the precise logging of VO2 max estimates and metabolic conditioning milestones. Key performance indicators included in the log focus on:
- Rate of Perceived Exertion (RPE) to gauge intensity levels.
- Post-exercise heart rate recovery duration.
- Consistency in aerobic endurance sessions.
- Steady-state cardio vs. interval training response.
Optimizing cardiac output and stroke volume requires consistent data analysis. This structured documentation ensures that fitness programming aligns with physiological adaptations, fostering peak cardiovascular health and sustainable athletic performance through data-driven insights.
Heart Rate Variability and Stress Journal
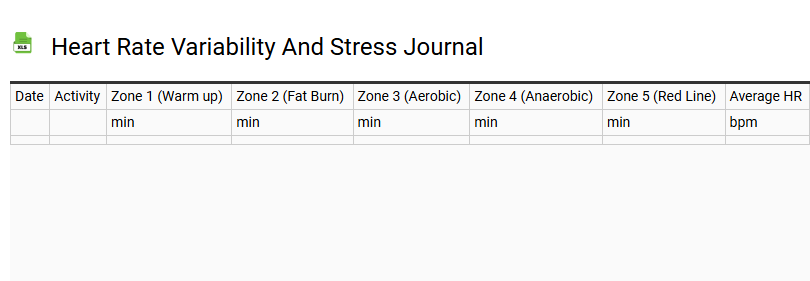
💾 Heart Rate Variability and Stress Journal .xls
A Heart Rate Variability (HRV) and Stress Journal serves as a sophisticated tool for monitoring the autonomic nervous system and its daily fluctuations. By documenting R-R intervals and vagal tone, this template provides a data-driven overview of the balance between sympathetic and parasympathetic activity. Users can utilize biometric tracking to correlate cortisol triggers with physical recovery and cardiovascular health. Consistent logging of physiological data helps establish a personal baseline, making it easier to identify signs of burnout or overtraining. Integrating biofeedback with mindfulness practices within this journal empowers individuals to improve emotional regulation and mental well-being. This comprehensive approach to stress management leverages vagus nerve insights, ensuring that lifestyle adjustments are backed by objective biometric feedback for optimal resilience and performance.
Karvonen Formula Zone Planner
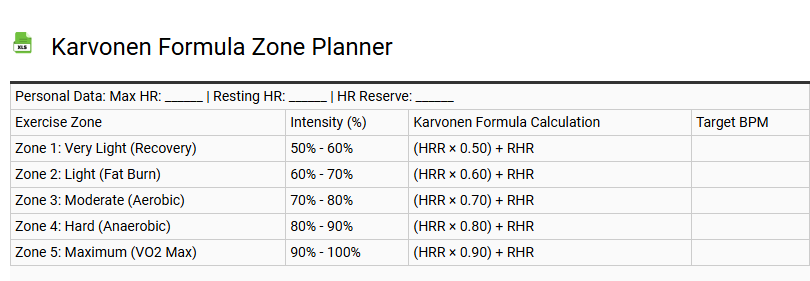
💾 Karvonen Formula Zone Planner .xls
This Karvonen Formula Zone Planner provides a sophisticated mathematical approach to personalizing cardiovascular training. By utilizing Heart Rate Reserve (HRR)-the difference between your maximal heart rate (MHR) and resting heart rate (RHR)-this method offers greater precision than standard age-based calculations. This tool identifies specific target heart rate (THR) ranges to optimize aerobic capacity, metabolic efficiency, and anaerobic threshold.
Tailoring intensity levels based on individual exercise physiology helps athletes manage physical exertion and improve VO2 max. Whether focusing on fat oxidation, active recovery, or peak athletic performance, this planner ensures your workouts align with specific fitness goals. Incorporating individual biometric data allows for a data-driven strategy to enhance cardiovascular health while preventing overtraining and maximizing endurance through calibrated intensity zones.
Lactate Threshold Heart Rate Test Log
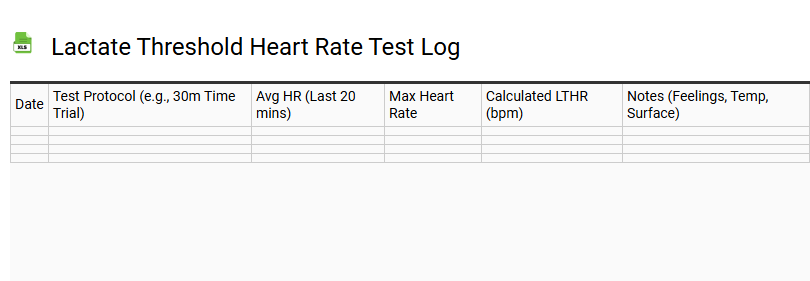
💾 Lactate Threshold Heart Rate Test Log .xls
A Lactate Threshold Heart Rate (LTHR) test log is a vital instrument for athletes aiming to refine their endurance training. By documenting metrics from a standardized field test protocol, such as a 30-minute time trial, individuals can pinpoint their anaerobic threshold. This physiological assessment identifies the intensity level where blood lactate accumulates faster than the body can clear it. Utilizing a structured template helps track cardiovascular fitness, average exertion levels, and recovery patterns. These data points are essential for calibrating heart rate zones, improving metabolic efficiency, and maximizing aerobic performance. Whether monitoring running pace or cycling power, consistent logging allows for precise adjustments to training intensity, ensuring optimal progress while preventing overtraining and fatigue during high-intensity sessions.
Treadmill Zone Performance Tracker
💾 Treadmill Zone Performance Tracker .xls
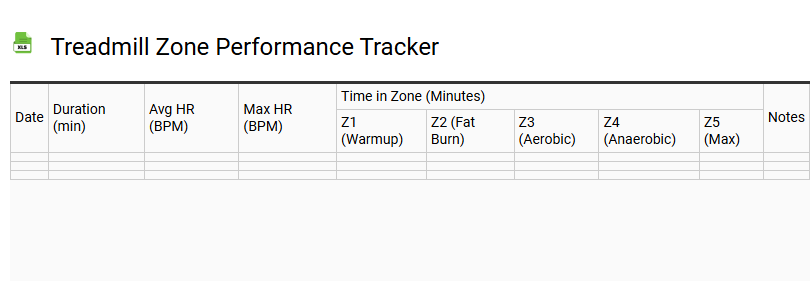
This treadmill zone performance tracker optimizes cardiovascular conditioning by monitoring critical fitness metrics. Users can systematically log interval training sessions, tracking variables like incline percentages, peak velocity, and specific heart rate zones.
By analyzing aerobic capacity and anaerobic thresholds, athletes refine their stamina and metabolic efficiency. This template streamlines workout logging, providing a granular view of:
- Caloric expenditure and endurance progression
- Incline settings and speed variations (MPH/KPH)
- Recovery intervals for optimal performance
- Targeted metabolic rate improvements
Whether focusing on low-intensity fat burn or high-intensity sprints, the integrated data fields ensure precision. This digital fitness log allows runners to visualize performance trends and maximize peak athletic output through consistent data-driven insights into their daily cardiovascular health routines.
Running Cadence and Heart Rate Correlation Chart
💾 Running Cadence and Heart Rate Correlation Chart .xls
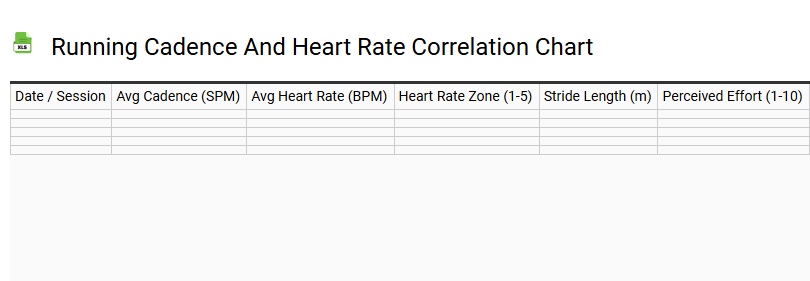
This tracking tool visualizes the dynamic relationship between running cadence, measured in steps per minute (SPM), and heart rate response. By monitoring these synchronized metrics, runners can evaluate their cardiovascular efficiency and overall running economy. Higher stride frequencies often correlate with reduced vertical oscillation, which can minimize physiological strain and lower metabolic cost at specific paces. Utilizing this correlation chart allows for precise gait analysis, helping athletes stay within their optimal aerobic threshold while managing training intensity. Understanding how biometric fluctuations impact biomechanics is crucial for improving endurance. Use this data-driven template to identify the ideal balance between mechanical output and internal effort, ensuring peak performance while mitigating the risk of fatigue-related injuries through objective performance monitoring.
Annual Heart Rate Trend Analysis Dashboard
💾 Annual Heart Rate Trend Analysis Dashboard .xls
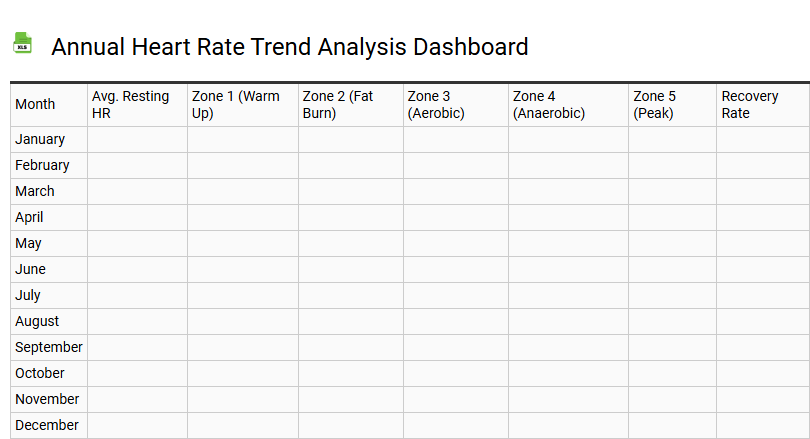
This Annual Heart Rate Trend Analysis Dashboard provides a sophisticated interface for monitoring long-term cardiovascular health. By centralizing biometric data, the template visualizes fluctuations in resting heart rate (RHR) and average beats per minute (BPM) over a 12-month period. This longitudinal analysis is essential for identifying heart rate variability (HRV) patterns and assessing cardiac efficiency.
The data-driven insights generated by this dashboard highlight seasonal variations and the physiological impact of fitness regimes. Users can track pulse consistency against established historical baselines to detect subtle anomalies in aerobic capacity or stress response. Integrated health metrics transform raw statistics into actionable intelligence, facilitating proactive wellness management. Designed for fitness tracking enthusiasts and healthcare professionals, this tool optimizes vital sign monitoring through intuitive data visualization and comprehensive physiological trend reporting.
This heart rate zone journal template provides a professional framework for monitoring cardiovascular performance. By documenting BPM across different intensity levels, you can effectively track Zone 2 endurance and anaerobic thresholds. Utilizing this log ensures precise data for fat-burning and VO2 max improvements. Start optimizing your cardio workouts by recording every session. Consistent tracking empowers you to achieve peak aerobic fitness through structured training zones. Use this log to transform fitness data into actionable insights for long-term athletic success.