
Long Covid Fatigue Recovery Log: Daily Tracking Template
Navigating post-viral fatigue requires a systematic approach to energy conservation and symptom monitoring. A structured Long Covid Fatigue Recovery Log serves as a vital tool for tracking daily energy envelopes, identifying post-exertional malaise (PEM) triggers, and monitoring physical exertion levels. By utilizing a chronic illness health journal, individuals can implement pacing strategies more effectively to manage persistent exhaustion. This data-driven approach supports gradual rehabilitation and enhances communication with healthcare providers. We invite you to check the already made variation of templates below.
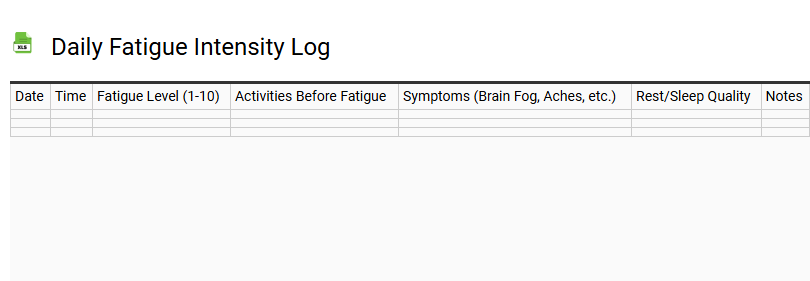
Daily Fatigue Intensity Log
💾 Daily Fatigue Intensity Log .xls
A Daily Fatigue Intensity Log serves as a specialized instrument for tracking chronic exhaustion and identifying burnout patterns. By systematically recording energy levels and sleep quality, individuals can pinpoint the relationship between physical exertion and mental fog.
This structured symptom tracking template focuses on:
- Identifying specific lifestyle triggers and stress markers.
- Monitoring biometric data and restorative rest cycles.
- Visualizing long-term health trends and stamina fluctuations.
Utilizing a wellness journal for activity monitoring facilitates data-driven insights into persistent lethargy. This proactive approach to health surveillance empowers users to modify daily routines, optimize recovery protocols, and communicate effectively with medical professionals regarding vitality deficits. Consistent documentation is essential for managing systemic fatigue and enhancing overall metabolic health.
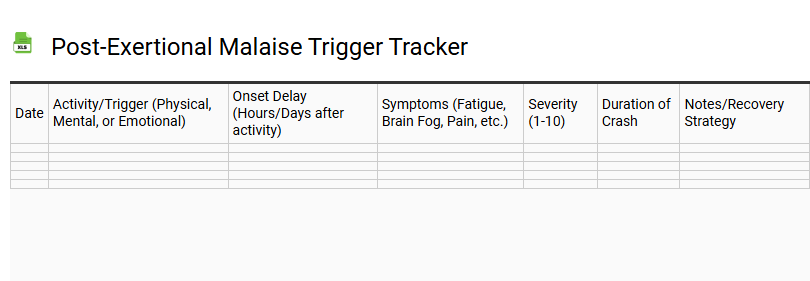
Post-Exertional Malaise Trigger Tracker
💾 Post-Exertional Malaise Trigger Tracker .xls
A Post-Exertional Malaise (PEM) Trigger Tracker serves as a critical diagnostic utility for managing Myalgic Encephalomyelitis (ME/CFS), Long COVID, and systemic exertion intolerance. This template enables precise monitoring of the energy envelope, helping users identify the specific stressors that lead to debilitating symptom flare-ups or "crashes."
By meticulously documenting daily exertion, patients can correlate delayed symptom onset with various metabolic demands, including:
- Physical Activity: Identifying thresholds for orthostatic intolerance and aerobic strain.
- Cognitive Load: Tracking brain fog resulting from intense concentration or sensory stimuli.
- Emotional Stressors: Monitoring physiological responses to high-arousal social interactions.
Utilizing this data-driven approach facilitates effective pacing strategies and autonomic regulation. Consistent logging empowers individuals to recognize early warning signs, optimize recovery windows, and minimize the frequency of inflammatory relapses.
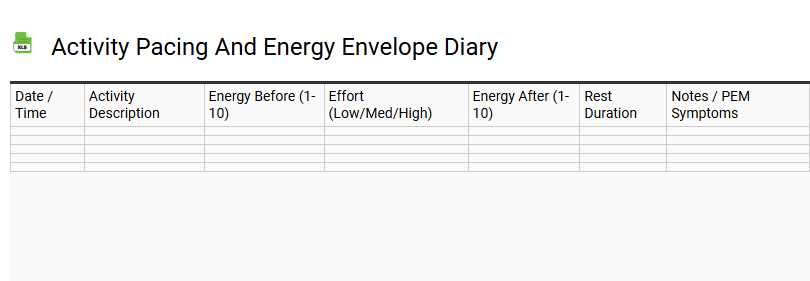
Activity Pacing and Energy Envelope Diary
💾 Activity Pacing and Energy Envelope Diary .xls
An Activity Pacing and Energy Envelope Diary is a critical fatigue management tool for tracking metabolic limits and daily exertion. By maintaining a detailed activity log, individuals managing Chronic Fatigue Syndrome (CFS), Fibromyalgia, or Long COVID can visualize their energy envelope, ensuring total energy expenditure stays within a safe baseline.
This systematic framework prioritizes energy conservation to avoid Post-Exertional Malaise (PEM). Key components of an effective diary include:
- Monitoring physical, cognitive, and emotional demands.
- Scheduling restorative rest to prevent symptom flares.
- Applying spoon theory for balanced pacing strategies.
Consistently documenting these metrics helps identify triggers, optimize recovery, and prevent crashes, fostering long-term stability through proactive symptom management and metabolic pacing.
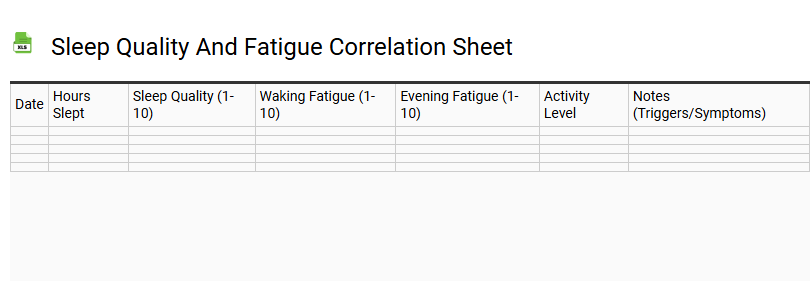
Sleep Quality and Fatigue Correlation Sheet
💾 Sleep Quality and Fatigue Correlation Sheet .xls
A Sleep Quality and Fatigue Correlation Sheet serves as a vital diagnostic tool for monitoring the intricate relationship between nocturnal rest and daytime performance. This template facilitates the tracking of sleep architecture variables, such as sleep latency, total duration, and the frequency of night-time awakenings. By documenting these metrics alongside a standardized fatigue scale, individuals can identify specific patterns affecting their circadian rhythm and cognitive function.
- Restorative Rest: Evaluating deep sleep and REM cycles to gauge physiological recovery.
- Sleep Hygiene: Logging environmental factors and pre-sleep habits that influence sleep efficiency.
- Daytime Drowsiness: Measuring alertness levels and peak exhaustion periods throughout the day.
Utilizing this data-driven approach helps pinpoint sleep disturbances and their direct impact on metabolic health and daily energy levels. Consistently mapping these correlations empowers users to optimize their habits for enhanced vitality and long-term wellness.
Brain Fog and Cognitive Load Monitor
💾 Brain Fog and Cognitive Load Monitor .xls
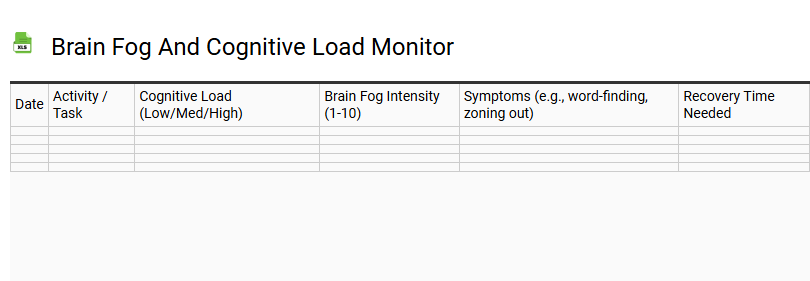
This specialized template functions as a comprehensive cognitive load monitor designed to track mental fatigue and optimize executive function. By logging daily fluctuations in neurological processing speed and attention span, users can identify specific triggers contributing to brain fog.
The system incorporates metrics for task complexity and stress management, providing a data-driven approach to burnout prevention. Integrating this tool into your productivity workflow facilitates focus optimization and memory retention analysis. Through consistent digital journaling of cognitive health markers, you can achieve better neurotransmitter balance and sustained mental clarity. This monitor acts as a vital resource for anyone seeking to quantify their intellectual stamina, manage sensory overload, and implement strategic pacing techniques for peak performance.
Nutritional Intake and Energy Level Journal
💾 Nutritional Intake and Energy Level Journal .xls
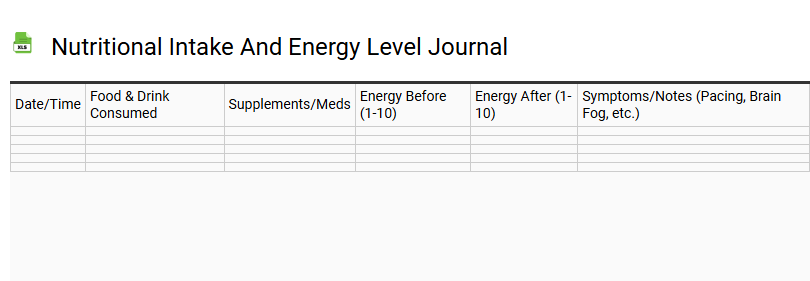
Utilizing a Nutritional Intake and Energy Level Journal allows for precise metabolic monitoring and personal dietary analysis. This structured template focuses on documenting caloric density, macronutrient distribution, and micronutrient variety to reveal how specific foods influence diurnal alertness and vitality.
By consistently logging meal timing and hydration status, users can identify patterns related to:
- Blood sugar stability and insulin response.
- Post-prandial fatigue or cognitive clarity.
- The impact of processed ingredients on systemic wellness.
- Optimal nutrient timing for peak physical performance.
This food diary serves as a robust health tool, bridging the gap between nutritional biochemistry and subjective energy fluctuations. Implementing this data-driven approach fosters metabolic flexibility and supports long-term holistic health objectives through mindful consumption patterns and evidence-based lifestyle adjustments.
Medication and Supplement Symptom Tracker
💾 Medication and Supplement Symptom Tracker .xls
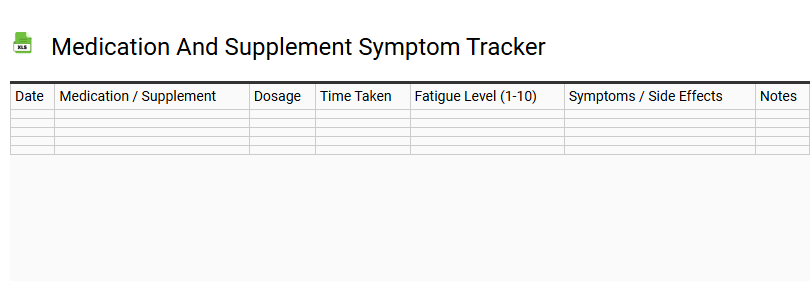
A comprehensive medication and supplement symptom tracker serves as a vital health log for monitoring therapeutic efficacy and identifying adverse reactions. By documenting specific dosage frequency, timing, and physical symptoms, individuals can uncover critical correlations between prescription drugs, nutritional supplements, and their daily wellbeing. This systematic data collection enhances patient records, providing healthcare providers with actionable insights to refine treatment plans. Monitoring side effects alongside pill intake helps mitigate potential drug interactions and optimizes personal wellness routines. Whether managing chronic conditions or a vitamin protocol, maintaining a detailed medication regimen log ensures safety and improves long-term health outcomes through precise symptom management and clinical observation.
Weekly Recovery Progress Dashboard
💾 Weekly Recovery Progress Dashboard .xls
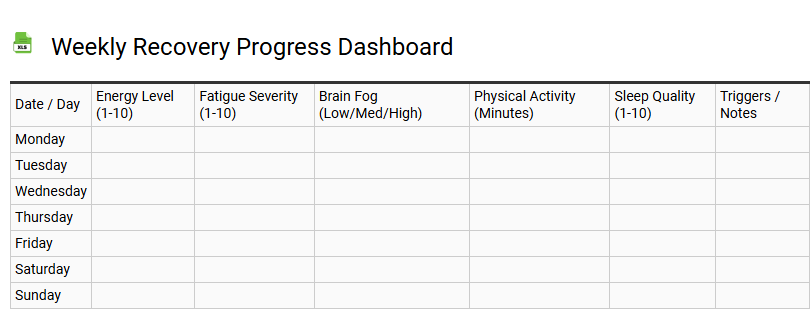
A Weekly Recovery Progress Dashboard serves as a centralized hub for monitoring rehabilitation milestones or system restoration efforts. This framework facilitates the objective measurement of daily improvements, ensuring that progress aligns with long-term restoration goals.
- Performance Indicators: Capture essential data points such as mobility scores, rest periods, or operational uptime to identify emerging patterns.
- Comparative Analysis: Evaluate current performance against previous benchmarks to visualize the rate of improvement over time.
- Strategic Insights: Document specific adjustments made to the recovery plan based on data-driven observations.
- Milestone Verification: Confirm the completion of critical tasks that signal a successful transition to the next phase of the process.
Utilizing this structured approach enhances transparency and provides a clear narrative of the journey toward full restoration. It empowers users to make informed decisions by highlighting successes and identifying areas requiring additional focus.
Physical Activity Tolerance Log
💾 Physical Activity Tolerance Log .xls
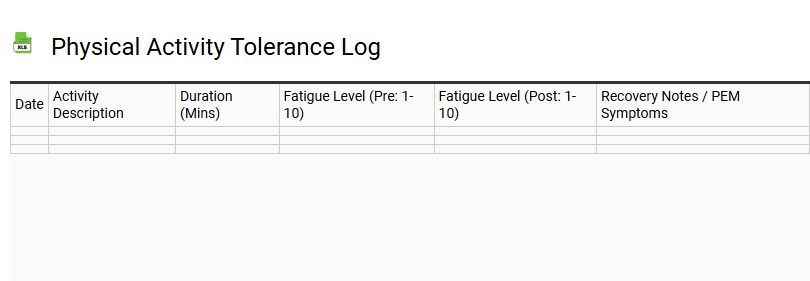
A physical activity tolerance log serves as a vital clinical tool for monitoring physiological responses to exercise and daily movement. By documenting exertion levels using the Borg Rating of Perceived Exertion (RPE) scale, individuals can effectively track cardiovascular endurance and aerobic capacity over time. This structured template captures essential data points, including resting heart rate, peak intensity, and post-workout recovery duration.
Utilizing a systematic tracking log assists in identifying specific triggers for fatigue, dyspnea, or physiological strain, ensuring safe progression within therapeutic limits. Whether applied in cardiac rehabilitation or athletic performance, the log integrates subjective symptoms with objective vitals. This exercise monitoring approach allows healthcare providers to adjust activity protocols based on metabolic demand and functional stamina. Consistently logging duration and intensity optimizes rehabilitation outcomes, enhances mobility, and prevents overexertion during physical therapy or routine fitness programming.
Stress Levels and Fatigue Map
💾 Stress Levels and Fatigue Map .xls
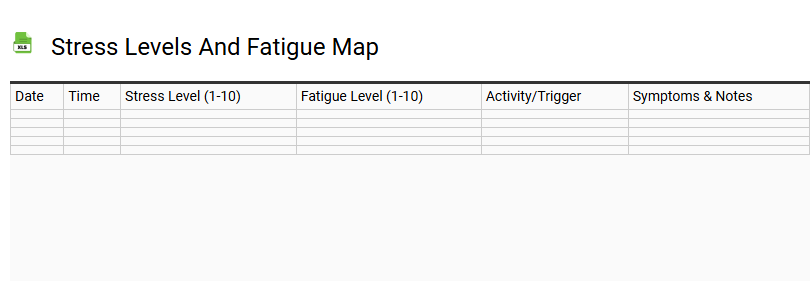
A Stress Levels and Fatigue Map template serves as a robust diagnostic framework for monitoring bio-psychosocial indicators and facilitating proactive burnout prevention. By systematically tracking daily energy expenditure against cognitive load, users can visualize the physiological impact on the sympathetic nervous system. This mapping process identifies the critical intersection between high-performance demands and emotional exhaustion.
Incorporating metrics such as heart rate variability (HRV), sleep hygiene, and psychosomatic symptoms, the template enables the scheduling of essential recovery cycles. This data-driven approach to wellness tracking optimizes circadian rhythms and mental resilience. By recognizing early patterns of chronic tiredness, individuals can implement restorative practices to maintain long-term performance optimization and equilibrium within their professional and personal environments.
Symptom Flare-up and Recovery Timeline
💾 Symptom Flare-up and Recovery Timeline .xls
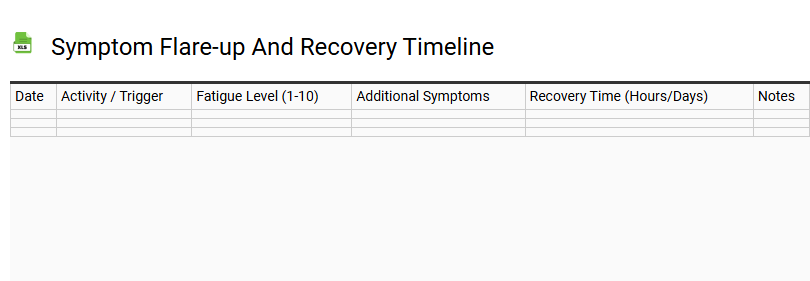
A Symptom Flare-up and Recovery Timeline serves as a critical diagnostic tool for monitoring disease progression and treatment efficacy. This structured chronology tracks the onset of health issues, identifying specific environmental triggers that lead to an acute exacerbation. By documenting the duration and severity of an episode, patients can visualize the healing trajectory toward their physiological baseline.
- Clinical assessment of episodic fluctuations and relapse patterns.
- Identification of remission phases during the convalescence period.
- Optimization of management strategies to reduce inflammatory responses.
- Longitudinal tracking of functional capacity and patient outcomes.
Monitoring the recovery window provides data-driven insights into pathophysiological rhythms, allowing for personalized therapeutic interventions and improved health monitoring throughout the rehabilitation process.
Heart Rate Variability and Pacing Log
💾 Heart Rate Variability and Pacing Log .xls
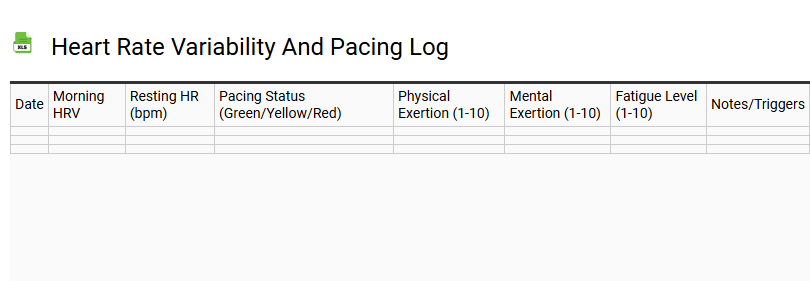
Utilizing a Heart Rate Variability (HRV) and Pacing Log is essential for monitoring the autonomic nervous system and maintaining your energy envelope. This structured template tracks vagal tone and RMSSD values, providing critical recovery metrics for individuals managing chronic fatigue, POTS, or dysautonomia.
- Baseline Measurements: Record daily morning readings to assess parasympathetic nervous system activity and readiness.
- Activity Tracking: Document exertion levels alongside wearable technology data to identify physiological triggers.
- Biofeedback: Use symptom management trends to adjust stress management protocols in real-time.
By integrating cardiovascular health indicators with subjective wellness scores, this log serves as a powerful biofeedback tool. Consistent monitoring facilitates pacing strategies, ensuring physical demands do not exceed biological capacity, ultimately stabilizing your baseline and preventing post-exertional malaise through data-driven recovery insights.
Morning vs Evening Energy Scale
💾 Morning vs Evening Energy Scale .xls
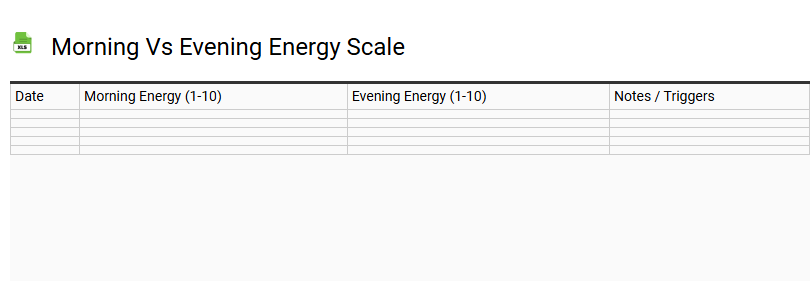
The Morning vs Evening Energy Scale serves as a strategic tool for analyzing circadian rhythms and identifying individual chronotypes. By monitoring daily fluctuations in vigor and cognitive function, users can align demanding tasks with their natural peak performance windows. This subjective assessment evaluates the sleep-wake cycle, determining whether a person exhibits a "lark" or "owl" diurnal preference.
Tracking these patterns helps optimize productivity levels by acknowledging how cortisol levels and the internal biological clock influence alertness. Utilizing this template assists in mitigating fatigue and managing metabolic shifts throughout the day. By synchronizing professional responsibilities with innate physiological peaks, individuals improve mental clarity and long-term sleep hygiene. This data-driven approach ensures that energy expenditure is harmonized with the body's natural restorative cycles for enhanced well-being.
Monthly Health Trend Visualizer
💾 Monthly Health Trend Visualizer .xls
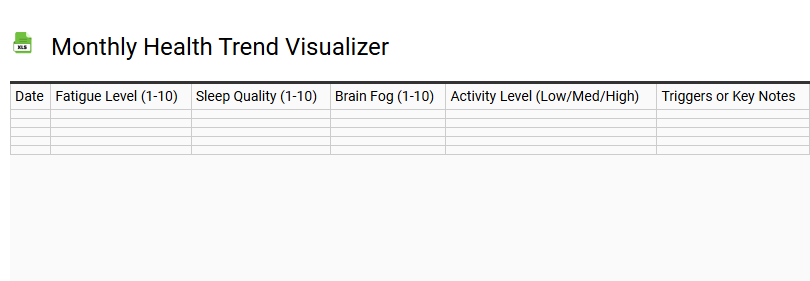
A Monthly Health Trend Visualizer serves as a sophisticated framework for the longitudinal analysis of biometric data. This health dashboard enhances wellness tracking by converting daily fitness metrics into intuitive data visualization charts. By monitoring key performance indicators (KPIs) such as heart rate variability, sleep patterns, and activity levels, users can achieve precise progress monitoring over a thirty-day cycle.
The template facilitates the identification of physiological correlations between nutritional intake and physical performance. Utilizing this data-driven approach allows for actionable insights, helping individuals refine their habits based on empirical health analytics. By centralizing vital signs and lifestyle factors, the visualizer simplifies self-quantification, ensuring a comprehensive overview of one's wellness journey and long-term health outcomes.
Hydration and POTS Symptom Tracker
💾 Hydration and POTS Symptom Tracker .xls
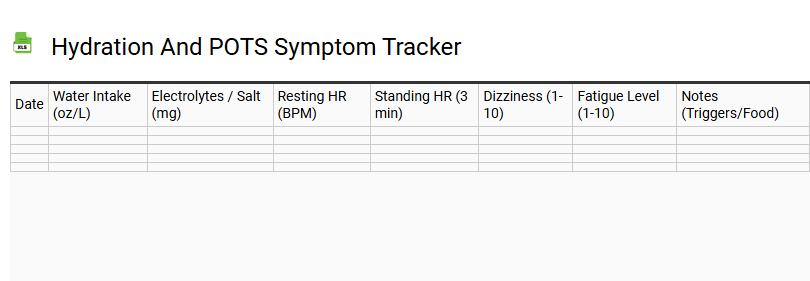
Managing Postural Orthostatic Tachycardia Syndrome (POTS) requires precise monitoring of daily physiological triggers and lifestyle interventions. This specialized hydration and symptom tracker provides a structured format to log fluid intake, sodium consumption, and electrolyte balance. By documenting fluctuations in heart rate, blood pressure, and orthostatic intolerance, users can identify patterns related to tachycardia and syncope.
Utilizing this dysautonomia log facilitates data-driven discussions with healthcare providers regarding salt loading protocols and autonomic nervous system stability. Tracking water intake alongside symptoms like dizziness or fatigue helps visualize the correlation between hydration levels and physical recovery. This template serves as an essential tool for those navigating the complexities of chronic illness management, ensuring every metric from electrolyte supplementation to orthostatic vitals is captured for optimal health outcomes.
Oxygen Saturation and Respiratory Effort Log
💾 Oxygen Saturation and Respiratory Effort Log .xls
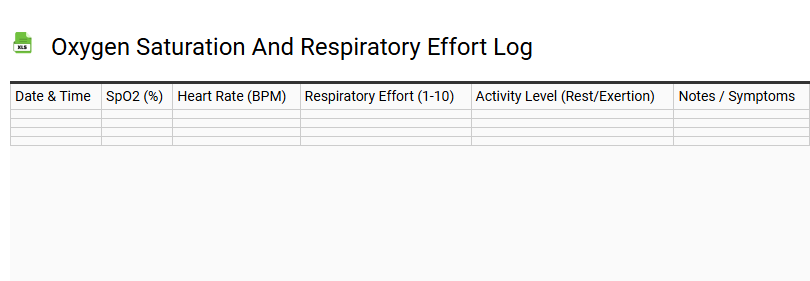
Efficiently monitor pulmonary health using this comprehensive template designed for tracking SpO2 levels and respiratory rate. This log facilitates precise pulse oximetry documentation, allowing patients and caregivers to record oxygen saturation percentages alongside subjective respiratory effort assessments. By capturing consistent data on breathing patterns and shortness of breath, the tool assists in managing chronic conditions such as COPD, asthma, or sleep apnea.
- Track baseline vitals for early hypoxemia detection.
- Document supplemental oxygen usage and exertion levels.
- Analyze lung function trends over specific 12 or 24-hour intervals.
Utilizing this structured clinical monitoring approach ensures accurate vital sign reporting for healthcare providers, optimizing oxygen therapy adjustments and enhancing overall respiratory wellness through data-driven insights.
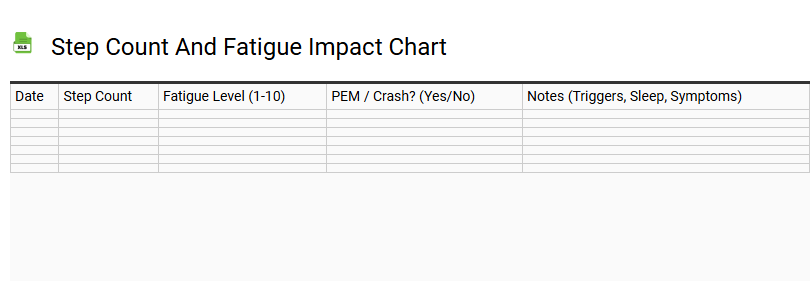
Step Count and Fatigue Impact Chart
💾 Step Count and Fatigue Impact Chart .xls
The Step Count and Fatigue Impact Chart serves as a vital analytical tool for correlating physical exertion with subjective energy levels. By documenting daily movement metrics alongside a fatigue scale, individuals can visualize the direct relationship between ambulatory activity and post-exertional malaise. This tracking template facilitates effective pacing strategies, helping users identify their anaerobic threshold or energy envelope. Integrating data from wearable devices into this activity log enhances health monitoring accuracy. Monitoring these performance metrics is essential for managing chronic fatigue, optimizing recovery phases, and preventing burnout. Through consistent longitudinal data collection, users gain actionable insights into how step volume influences systemic exhaustion, ultimately promoting a balanced approach to rehabilitation and daily wellness goals.
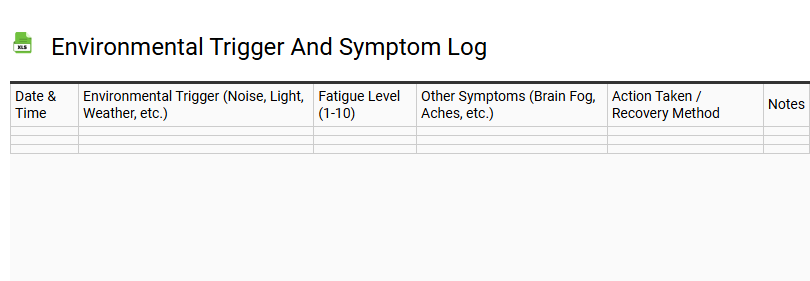
Environmental Trigger and Symptom Log
💾 Environmental Trigger and Symptom Log .xls
An Environmental Trigger and Symptom Log serves as a sophisticated monitoring tool for identifying correlations between external stressors and physiological responses. By systematically documenting exposure to allergens, pollutants, and weather fluctuations, users can pinpoint specific irritants such as mold, pollen, or volatile organic compounds (VOCs).
Tracking symptom severity alongside air quality indices (AQI) and indoor humidity levels provides crucial clinical insights for managing chronic conditions like asthma or seasonal rhinitis. Consistent data entry highlights patterns in respiratory health and inflammatory flares, enabling more productive consultations with a healthcare provider. Key metrics to record include:
- Onset and duration of physical reactions.
- Potential environmental sensitivities in specific locations.
- Atmospheric triggers and chemical exposure levels.
- Temporal links to chronic health flare-ups.
Utilizing this template facilitates a data-driven approach to wellness, helping individuals mitigate risks and optimize their living environments through precise exposure tracking.
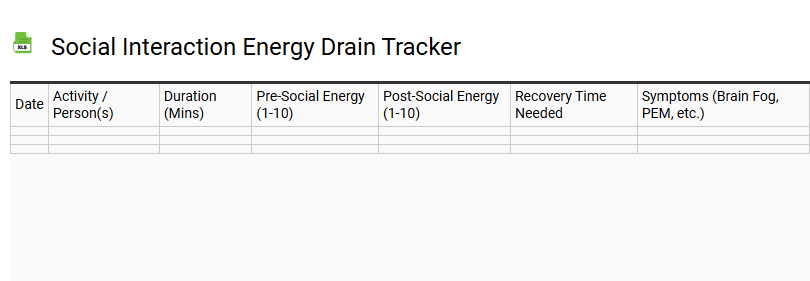
Social Interaction Energy Drain Tracker
💾 Social Interaction Energy Drain Tracker .xls
Utilizing a social interaction energy drain tracker is a vital strategy for managing your social battery and preventing emotional burnout. This specialized log helps introverts and individuals prone to sensory overload monitor their interpersonal exhaustion levels in real-time. By documenting key metrics-such as engagement duration, environment type, and the intensity of emotional labor-users gain deep insights into their personal social capacity.
Systematically recording these data points highlights specific triggers that accelerate social fatigue versus activities that offer restorative value. Understanding the necessary recovery period following high-stimulation events allows for better scheduling and proactive mental health maintenance. This energy management tool empowers you to balance external demands with essential solitude. By analyzing trends in your social drainage, you can optimize your daily routine, safeguard your psychological well-being, and implement effective recharge strategies tailored to your unique neurological needs.
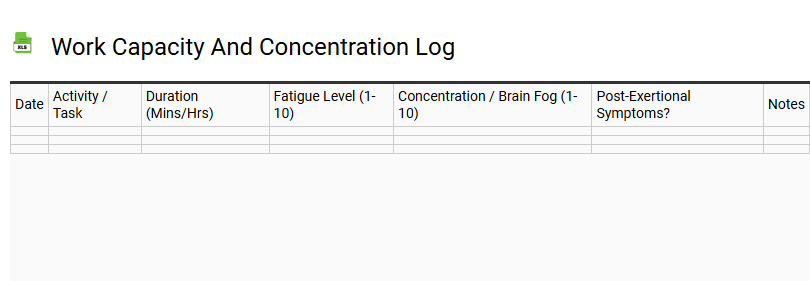
Work Capacity and Concentration Log
💾 Work Capacity and Concentration Log .xls
A Work Capacity and Concentration Log serves as a functional tool for monitoring daily output and mental endurance. By documenting specific tasks alongside focus levels, individuals can identify peak performance intervals and potential fatigue patterns throughout the workweek.
- Time Tracking: Note the duration spent on deep work versus administrative duties to understand time allocation.
- Focus Rating: Evaluate mental clarity on a consistent scale to pinpoint recurring distractions or high-engagement periods.
- Energy Assessment: Record physical and cognitive stamina to align demanding projects with peak vitality.
- Output Measurement: Quantify completed objectives to gauge overall efficiency and professional growth.
Utilizing this structured approach enables better resource management and highlights optimal windows for complex problem-solving. Regular entries help in adjusting workflows to align with natural productivity cycles, ensuring sustained performance without burnout.
This Long Covid fatigue recovery log template streamlines symptom tracking for those navigating post-viral malaise. By monitoring daily fluctuations, users can:
- Maintain a consistent energy envelope.
- Implement effective activity pacing strategies.
- Identify chronic illness triggers.
Using this baseline monitoring tool facilitates documenting recovery milestones and restorative rest. Ultimately, this approach enhances your wellness journey, providing the data necessary for informed chronic fatigue management and long-term health stabilization.