
Luteal Phase Defect Monitoring Template: Data Tracking and Analysis Guide
Monitoring hormonal health is essential for individuals tracking fertility or managing menstrual cycle irregularities. A luteal phase defect monitor helps identify short cycles and insufficient progesterone production after ovulation. By documenting basal body temperature (BBT) and cycle length, you can pinpoint hormonal imbalances affecting conception. Using a structured template simplifies recording these vital biomarkers, ensuring accurate data for clinical consultations and reproductive wellness. Please check the already made variation of templates below.
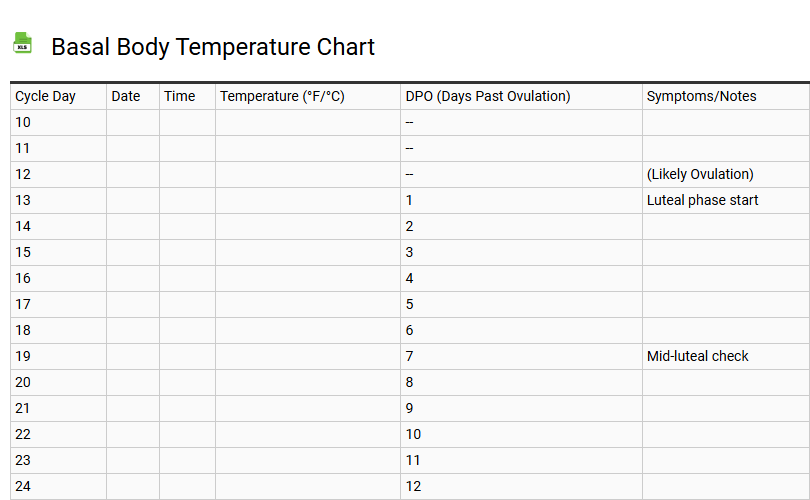
Basal Body Temperature Chart
💾 Basal Body Temperature Chart .xls
A Basal Body Temperature (BBT) chart template serves as a critical instrument for fertility tracking and monitoring the nuances of the menstrual cycle. By recording daily resting temperatures with a high-precision digital thermometer, individuals can identify the biphasic pattern necessary to confirm ovulation. This significant thermal shift, triggered by increased progesterone secretion, distinguishes the follicular phase from the luteal phase.
Utilizing a structured fertility window tracker facilitates the fertility awareness method (FAM). These templates often integrate secondary biomarkers like cervical mucus consistency to enhance accuracy. Whether the goal is conception or monitoring reproductive health, a consistent BBT log visualizes hormonal fluctuations, helping pinpoint peak fertility and predicting the onset of menses through detailed biological data visualization.
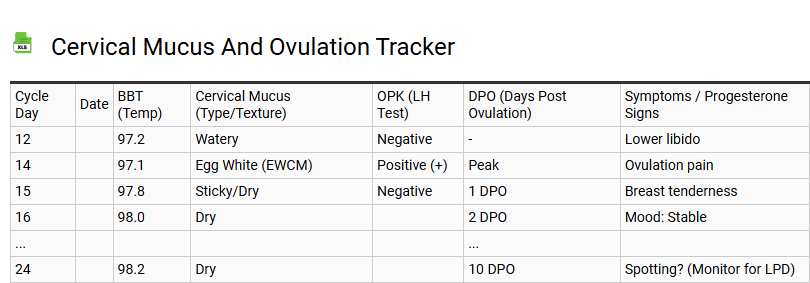
Cervical Mucus and Ovulation Tracker
💾 Cervical Mucus and Ovulation Tracker .xls
Utilizing a cervical mucus and ovulation tracker is a fundamental practice for monitoring the menstrual cycle and identifying the peak fertility window. By documenting daily changes in vaginal discharge-ranging from dry and sticky to creamy or egg white cervical mucus (EWCM)-users can accurately predict the release of an egg. This biological marker reflects rising estrogen levels during the follicular phase.
Integrating these observations with basal body temperature (BBT) and luteinizing hormone (LH) surges provides a comprehensive view of reproductive health. Whether the goal is conception or natural family planning, tracking consistent patterns helps pinpoint fertile days. A structured template facilitates better communication with healthcare providers regarding hormonal shifts. Consistent symptom tracking empowers individuals to understand their unique rhythm, optimizing the chances of pregnancy through precise ovulation prediction and fertility awareness.
Cycle Phase Length Calculator
💾 Cycle Phase Length Calculator .xls
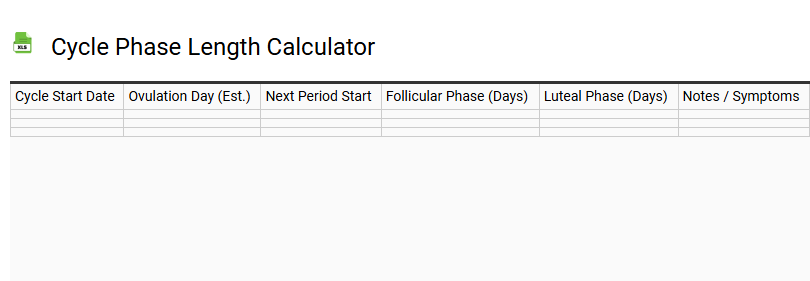
This calculator determines the specific duration of each stage within a menstrual cycle. By analyzing the total number of days between periods, it identifies the primary windows that define reproductive health and recurring hormonal shifts.
Accurate tracking relies on the following components:
- Follicular Phase: The time from the first day of a period until ovulation begins, varying in length based on individual biology.
- Ovulation: The critical window mid-cycle when fertility is at its peak and an egg is released.
- Luteal Phase: The consistent period following ovulation, ending just before the next menstruation starts.
Using these metrics allows for better prediction of future dates and a deeper understanding of personal physiological rhythms. It simplifies biological data into actionable insights for fertility management or general wellness monitoring, ensuring users stay informed about their body's natural timing and patterns.
Progesterone Symptom Log
💾 Progesterone Symptom Log .xls
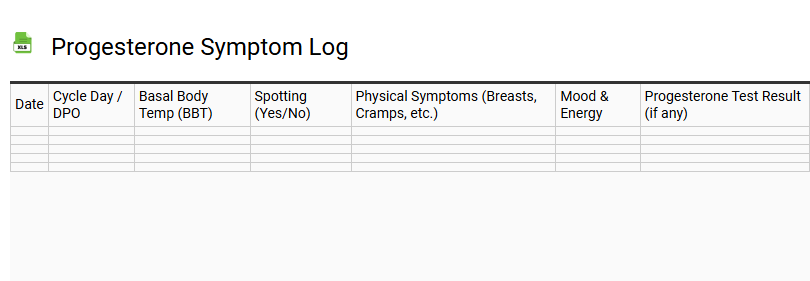
A progesterone symptom log serves as a vital diagnostic tool for monitoring reproductive health and hormonal balance. By systematically recording daily changes during the luteal phase, individuals can identify patterns related to progesterone levels and their impact on the menstrual cycle. This template facilitates tracking essential metrics such as basal body temperature (BBT), ovulation timing, and hormone-related symptoms.
Commonly monitored data points include:
- Breast tenderness, bloating, and fatigue.
- Mood swings and emotional hormonal fluctuations.
- Cycle regularity and luteal phase length.
Consistent documentation assists in detecting estrogen dominance or progesterone deficiency, providing actionable data for healthcare providers. Utilizing a structured log ensures precise observation of PMS symptoms, empowering users to optimize their fertility journey and gain deeper insights into their endocrine function and overall wellness.
Ovulation to Period Interval Tracker
💾 Ovulation to Period Interval Tracker .xls
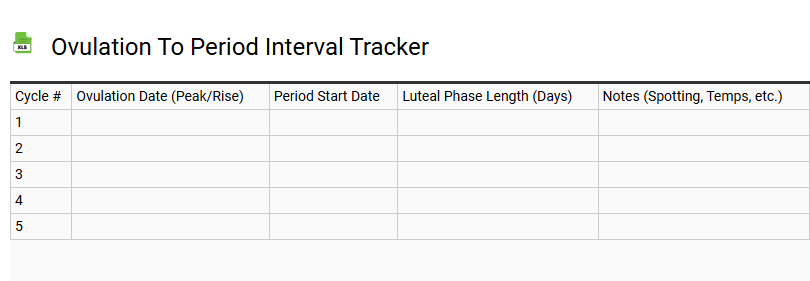
Tracking the duration between ovulation and the start of your next menstrual cycle provides vital insights into your reproductive health. This specific timeframe, known as the luteal phase, typically remains consistent for most individuals, even when the total cycle length fluctuates. By utilizing this interval tracker, you can more accurately predict the arrival of your period and identify personal patterns in your hormonal health.
To use the template effectively, record the date of ovulation and the first day of your subsequent menstruation. Monitoring these metrics over several months establishes a reliable baseline for your body. This data is essential for:
- Identifying the most fertile days of your cycle.
- Predicting period start dates with higher precision.
- Noticing shifts that may indicate health changes.
Understanding this interval empowers you to plan effectively and maintain a proactive approach to your personal wellness.
Fertility Awareness Method Spreadsheet
💾 Fertility Awareness Method Spreadsheet .xls
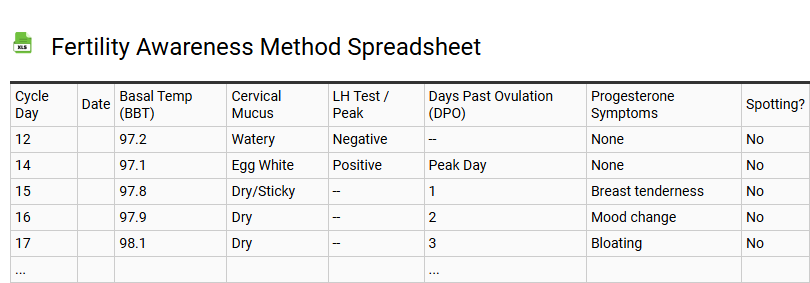
A comprehensive Fertility Awareness Method (FAM) spreadsheet template serves as a vital tool for precise cycle mapping and reproductive health monitoring. By integrating key biological markers like Basal Body Temperature (BBT) and cervical mucus consistency, users can accurately identify their fertile window.
This digital log streamlines the sympto-thermal method, allowing for meticulous tracking of the follicular and luteal phases. Utilizing a structured spreadsheet helps visualize hormonal shifts, pinpointing the peak day and confirming ovulation through thermal shifts.
Whether for natural family planning or optimizing conception, these templates organize daily data points-including cycle length and cervical position-into actionable insights. By maintaining a consistent charting habit, individuals gain autonomy over their hormonal health. This data-driven approach enhances predictive accuracy for future cycles, ensuring a holistic understanding of one's unique reproductive rhythm.
Post-Ovulation Temperature Sustenance Log
💾 Post-Ovulation Temperature Sustenance Log .xls
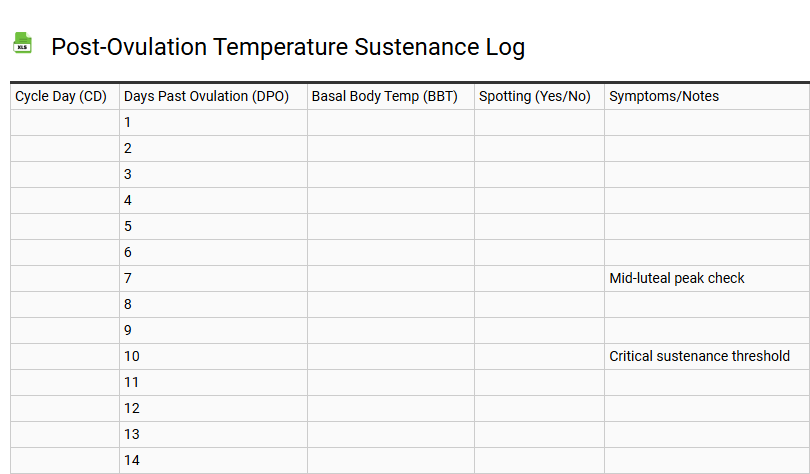
A Post-Ovulation Temperature Sustenance Log is a vital tool for monitoring the luteal phase of the menstrual cycle. Following the LH surge, the corpus luteum secretes progesterone, which triggers a localized thermal shift. This log tracks the sustained rise in basal body temperature (BBT), confirming that ovulation has successfully occurred.
By documenting daily readings, users can visualize a biphasic chart, which is essential for:
- Identifying the fertility window and peak conception timing.
- Monitoring progesterone levels and thermogenesis.
- Assessing the duration of the post-ovulatory period for hormonal balance.
- Detecting early signs of pregnancy or the onset of menstruation.
Utilizing this template ensures precise ovulation tracking, providing high-quality data for reproductive wellness and diagnostic discussions with healthcare providers regarding your menstrual health and ovulatory cycles.
Luteal Phase Spotting Journal
💾 Luteal Phase Spotting Journal .xls
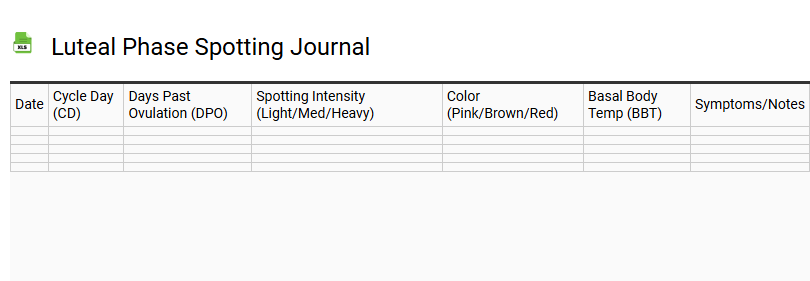
Utilizing a luteal phase spotting journal is an essential practice for monitoring reproductive health and identifying hormonal fluctuations. This tracking tool focuses on the interval between ovulation and the onset of menstruation, helping users distinguish between implantation bleeding and premature uterine shedding. By documenting mid-cycle light bleeding, you can provide clinical insights into your progesterone levels and overall endocrine system function.
A comprehensive journal template should include data points such as:
- Basal body temperature (BBT) shifts to confirm the post-ovulatory phase.
- Spotting duration, color (brown, pink, or bright red), and flow intensity.
- Changes in cervical mucus consistency.
- Secondary symptoms like pelvic cramping or breast tenderness.
Consistently logging these metrics within your menstrual cycle diary aids in detecting a luteal phase defect or other hormonal imbalances, facilitating more productive discussions with healthcare providers regarding fertility and cycle regularity.
Daily Progesterone Support Tracker
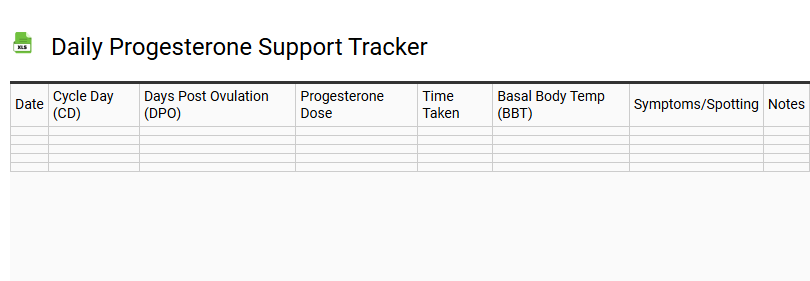
💾 Daily Progesterone Support Tracker .xls
This daily progesterone support tracker provides a structured way to monitor hormonal intake during fertility treatments or pregnancy maintenance. Maintaining stable levels is critical, and documenting each dose ensures clinical consistency. Use this template to record the date, exact time, and administration method-whether oral, vaginal, or via injection.
Beyond logging the dosage, this tool allows you to track physical observations and emotional shifts. Monitoring these details helps you and your healthcare provider evaluate how your body responds to the supplement. Reliable data collection simplifies your routine and offers peace of mind by confirming every requirement of your protocol is met.
- Record dosage amounts and delivery types.
- Log daily symptoms to identify patterns.
- Ensure timing accuracy for hormonal stability.
- Improve communication with your medical team.
BBT Rise Duration Monitor
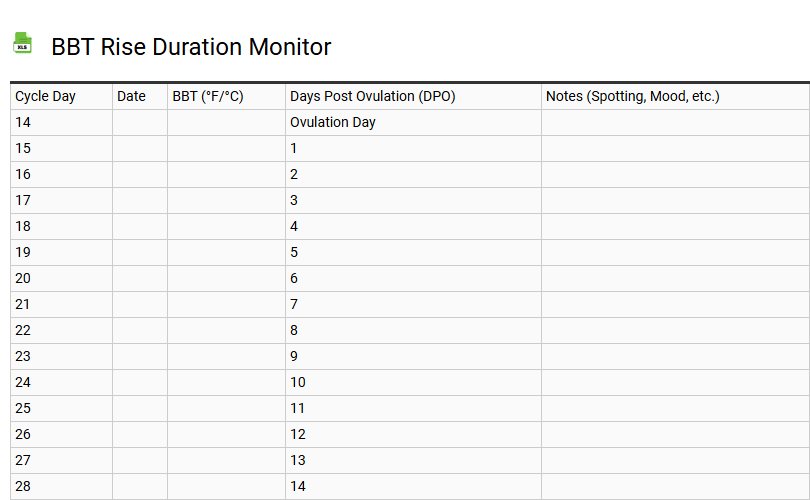
💾 BBT Rise Duration Monitor .xls
The BBT Rise Duration Monitor serves as a specialized tool for tracking the luteal phase and identifying critical hormonal shifts throughout the menstrual cycle. By meticulously logging daily basal body temperature, users can pinpoint the post-ovulatory thermal shift driven by rising progesterone levels.
This template facilitates precise cycle mapping, highlighting the biphasic pattern necessary for confirming ovulation and determining the fertility window. Monitoring the duration of the temperature rise is essential for evaluating corpus luteum function and overall reproductive health.
Optimized for conception planning and hormonal health monitoring, this digital record provides data-driven insights into fertility awareness. By analyzing the consistency of the thermal rise, individuals can detect potential imbalances or confirm successful cycle progression, ensuring accurate data for natural family planning and long-term reproductive wellness.
Cycle Day and Hormone Level Correlation Sheet
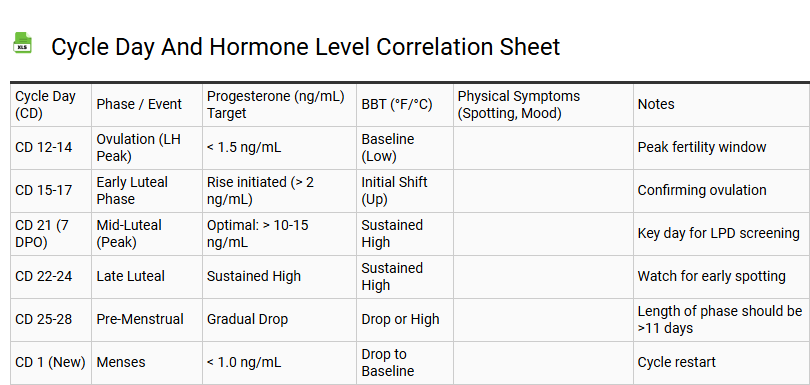
💾 Cycle Day and Hormone Level Correlation Sheet .xls
A Cycle Day and Hormone Level Correlation Sheet serves as a sophisticated instrument for monitoring menstrual cycle phases and reproductive health. By mapping specific hormonal fluctuations against standardized cycle days, this template visualizes the critical interplay between estrogen, progesterone, LH (luteinizing hormone), and FSH. During the follicular phase, tracking rising estradiol levels helps predict the LH surge, which is essential for precise ovulation tracking and identifying the fertility window. Post-ovulation data focuses on the luteal phase, where progesterone dominance confirms successful egg release. Utilizing this endocrine profile helps identify hormonal imbalances or irregularities in the 28-day cycle. This systematic approach to biometric data provides actionable insights for both clinical assessments and personal wellness, ensuring a comprehensive understanding of individual reproductive endocrine patterns and overall metabolic health.
Short Luteal Phase Identification Tool
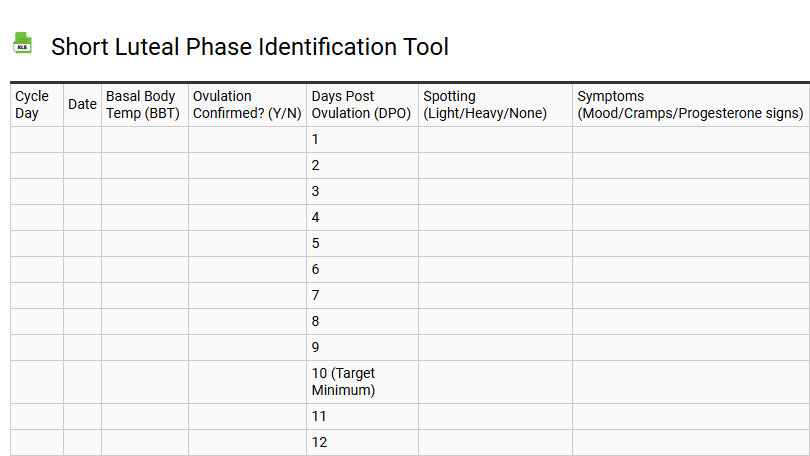
💾 Short Luteal Phase Identification Tool .xls
A Short Luteal Phase Identification Tool serves as a vital diagnostic resource for monitoring menstrual cycle health and detecting potential hormonal imbalances. By tracking the post-ovulation window, this screening utility helps identify luteal phase deficiency, typically characterized by a duration of fewer than ten days.
The tool utilizes basal body temperature (BBT) charting and ovulation detection to assess progesterone production and corpus luteum function. Evaluating the interval between the LH surge and the onset of menstruation is critical for ensuring the uterine lining is prepared for embryo implantation. Through consistent fertility tracking and data-driven analysis of cycle length, users can recognize patterns of estrogen dominance or diminished progesterone levels. This systematic approach empowers individuals to provide clinicians with precise reproductive health data, facilitating targeted interventions for conception hurdles and endocrine optimization.
Biphasic Pattern Analyzer
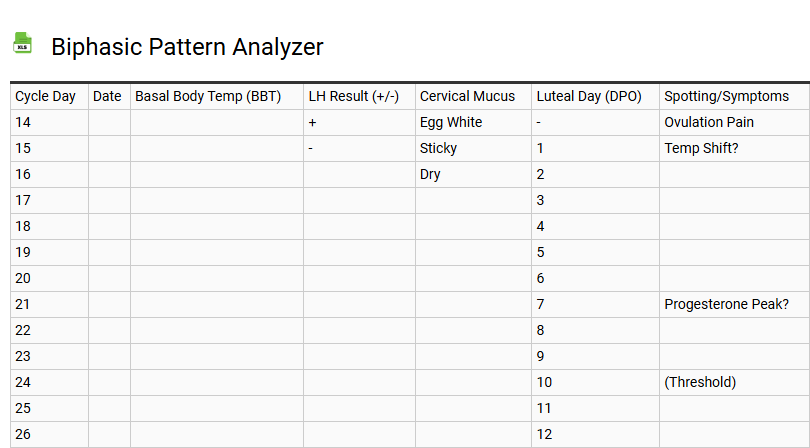
💾 Biphasic Pattern Analyzer .xls
This Biphasic Pattern Analyzer template provides a sophisticated framework for interpreting basal body temperature (BBT) fluctuations and menstrual cycle dynamics. By identifying the critical thermal shift, users can accurately distinguish between the follicular phase and the luteal phase, which are primary indicators of reproductive health. This data-driven tool facilitates the tracking of hormonal transitions, specifically monitoring the progesterone rise post-ovulation.
Utilizing fertility awareness methods, the analyzer highlights physiological patterns such as the nadir and sustained hyperthermic shifts. These metrics are essential for mapping the fertile window, assessing ovulatory function, and understanding hormonal balance. Structured for clarity, the template organizes daily charting data into actionable insights, ensuring precise cycle length monitoring and biomarker correlation for optimized reproductive wellness and natural family planning protocols.
Implantation Window Estimator
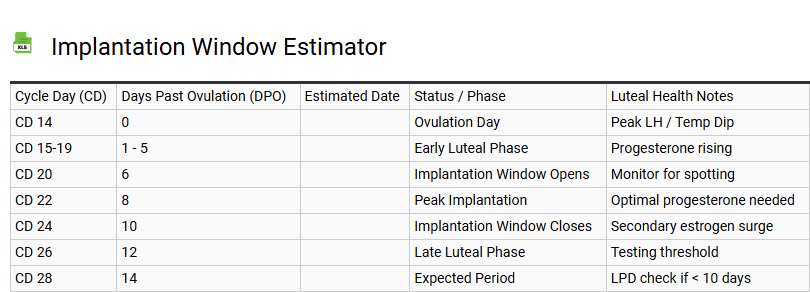
💾 Implantation Window Estimator .xls
The Implantation Window Estimator provides a data-driven approach to identifying the brief period of endometrial receptivity essential for a successful pregnancy. By analyzing menstrual cycle regularity and ovulation timing, this tool calculates the optimal luteal phase stage where the uterine lining is most prepared for blastocyst attachment.
Key factors, including progesterone levels and uterine wall thickness, determine the success of embryo transfer and natural conception. This template simplifies complex reproductive health data, helping users synchronize fertility tracking with biological peaks. Whether navigating IVF or monitoring conception windows, understanding the trophoblast interaction within this temporal frame is vital. Leveraging these insights enhances reproductive outcomes by pinpointing the exact days when the endometrium is biochemically primed for nidation, ensuring better precision in family planning.
Post-Peak Phase Symptom Diary
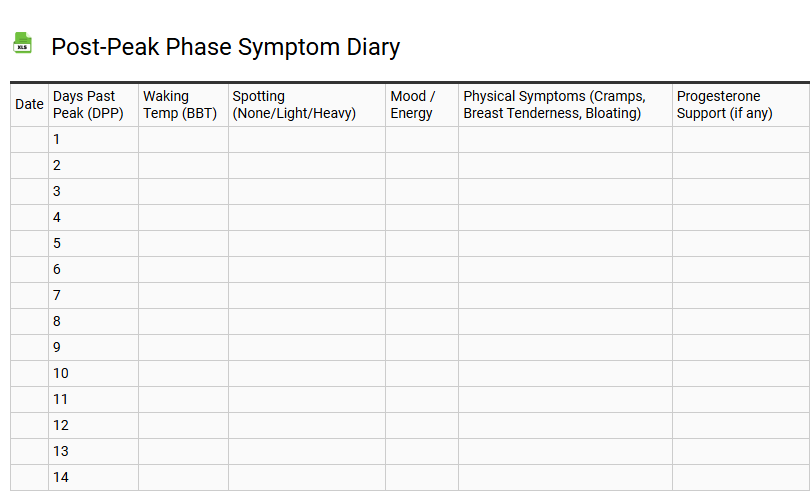
💾 Post-Peak Phase Symptom Diary .xls
This tracking tool is designed to monitor your health progression during the recovery window following a symptomatic surge. By documenting the gradual decline of physical and cognitive signals, you gain a clearer picture of your healing trajectory. Focus on recording the duration of lingering fatigue, the intensity of residual discomfort, and any fluctuations in energy levels as you reintegrate into daily routines.
Consistently updating these entries helps identify patterns that may indicate a need for adjusted rest or professional consultation. Maintaining an organized history of your convalescence provides actionable insights for personalized care. Use the structured fields below to log daily observations, ensuring every nuance of your recuperation is captured. This data bridges the gap between active illness and full wellness, offering a detailed map of your unique path to stability.
Hormonal Balance Tracking Sheet
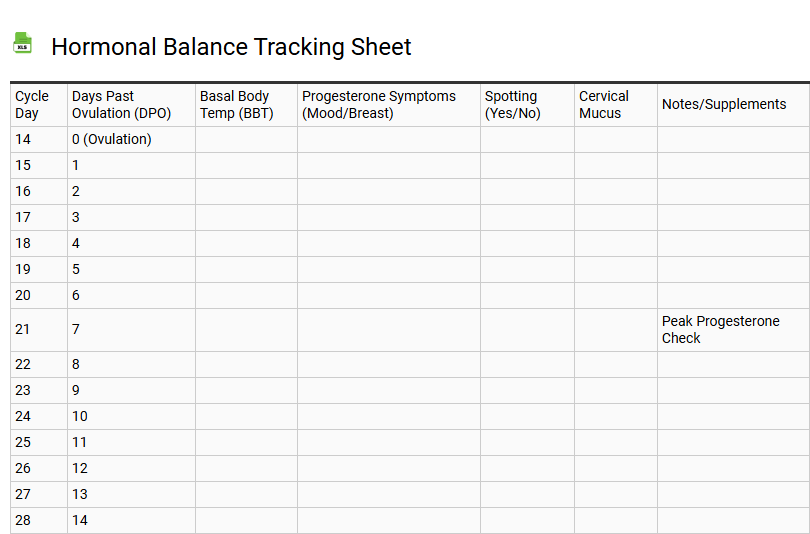
💾 Hormonal Balance Tracking Sheet .xls
A hormonal balance tracking sheet serves as a comprehensive tool for monitoring endocrine health and physiological fluctuations. By logging daily metrics, users can identify intricate patterns between estrogen, progesterone, and cortisol levels. This data-driven approach is essential for managing symptoms such as chronic fatigue, mood disturbances, and irregular menstrual cycles.
Integrating a structured log helps correlate lifestyle factors with biological responses. Key focus areas include:
- Menstrual cycle phases and ovulation windows.
- Daily energy levels and sleep architecture quality.
- Basal body temperature for thyroid function insights.
- Stress triggers impacting adrenal health and metabolic rate.
- Nutritional intake and physical activity recovery.
Utilizing a template facilitates hormonal harmony by providing objective data for healthcare consultations. Consistent documentation empowers individuals to implement targeted wellness strategies, optimizing long-term vitality and reproductive health through informed lifestyle adjustments.
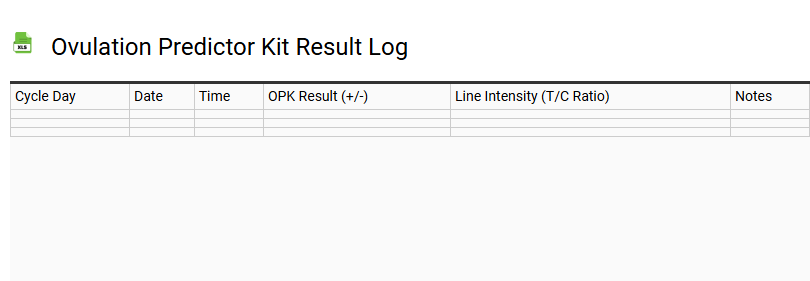
Ovulation Predictor Kit Result Log
💾 Ovulation Predictor Kit Result Log .xls
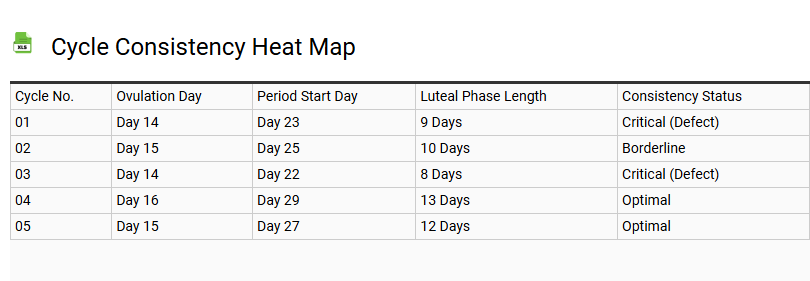
Cycle Consistency Heat Map
💾 Cycle Consistency Heat Map .xls
A Cycle Consistency Heat Map serves as a diagnostic tool for evaluating the reliability of temporal correspondences in video sequences. It visualizes the spatial drift that occurs when a feature point is tracked from a source frame to a target frame and back to its origin. The resulting map calculates the Euclidean distance between the starting coordinates and the returned position, providing a clear metric for tracking accuracy.
In this visualization, high-intensity regions highlight areas of significant displacement, often caused by occlusions, rapid motion, or complex deformations. Conversely, low-intensity zones indicate stable temporal associations where the model maintains high confidence. By identifying these localized errors, developers can refine self-supervised learning algorithms and improve the robustness of optical flow or object tracking models without the need for manual annotations.
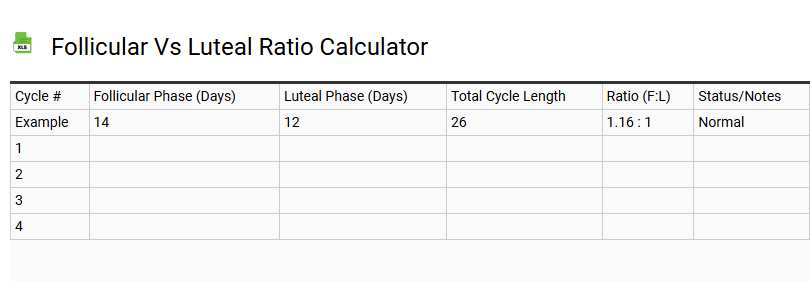
Follicular vs Luteal Ratio Calculator
💾 Follicular vs Luteal Ratio Calculator .xls
The Follicular vs Luteal Ratio Calculator is an essential tool for monitoring menstrual cycle dynamics and hormonal balance. By analyzing the duration of the follicular phase-starting from menstruation to ovulation-against the luteal phase, users can identify patterns in their reproductive health. A precise ratio helps detect luteal phase deficiency or potential progesterone imbalances, which are critical for successful fertility tracking and conception.
Understanding these hormonal fluctuations provides insight into the ovulatory process and overall endocrine system function. Use this template to input your cycle length and track estrogen dominance or variations in phase timing. Maintaining a healthy ratio ensures the uterine lining is adequately prepared for implantation, making this data invaluable for those managing polycystic ovary syndrome (PCOS) or tracking basal body temperature trends for peak wellness.
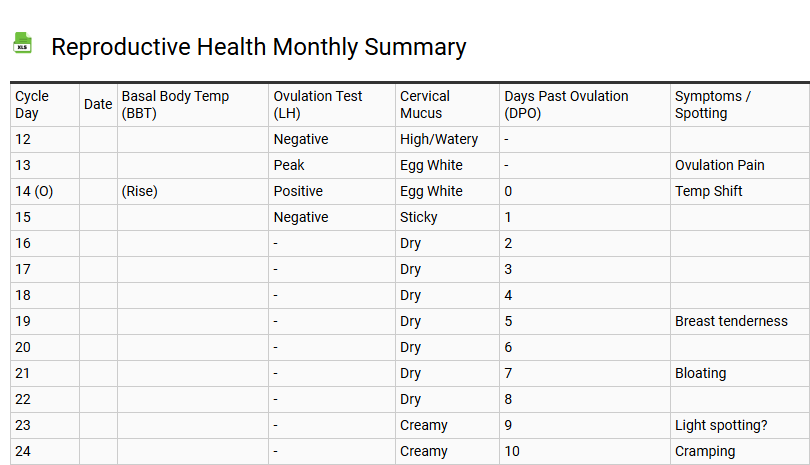
Reproductive Health Monthly Summary
💾 Reproductive Health Monthly Summary .xls
A Reproductive Health Monthly Summary serves as a vital clinical reporting tool for tracking maternal health outcomes and family planning service delivery. This template facilitates the systematic documentation of prenatal care milestones, contraceptive services, and sexual health screenings. By aggregating patient statistics, healthcare providers can monitor reproductive wellness trends and evaluate the efficacy of gynecological visits.
- Key metrics: STI testing rates and maternal morbidity data.
- Operational insights: Resource allocation for obstetrics and fertility treatments.
- Compliance: Ensuring clinical documentation meets public health standards.
Implementing a standardized summary enhances data tracking accuracy, allowing for longitudinal analysis of patient demographics and treatment interventions. This structured approach optimizes healthcare administration and improves long-term reproductive health outcomes through data-driven decision-making.
This specialized luteal phase defect monitor template provides a robust framework for tracking progesterone levels and basal body temperature (BBT). By consistently logging menstrual cycle data, users can identify signs of progesterone deficiency or a shortened post-ovulation window. This reproductive health tool enhances ovulation oversight and optimizes the fertility window. Utilizing this structured approach ensures better hormonal balance insights. Start your journey toward improved fertility monitoring by leveraging this detailed tracking system for clearer diagnostic patterns.