
Menopause Fat Loss Tracker Template: A Structured Guide to Monitoring Progress
Navigating the menopausal transition requires a strategic approach to metabolic health and weight management. Utilizing a specialized menopause fat loss tracker empowers you to monitor hormonal shifts, abdominal adipose tissue, and muscle mass retention effectively. By documenting daily nutritional intake, sleep quality, and physical activity, you can identify how fluctuating estrogen levels influence your body composition. A structured fitness template simplifies tracking these variables to ensure sustainable results. Please explore our curated collection of pre-made template variations below to find your ideal layout.
Menopause Fat Loss Daily Log
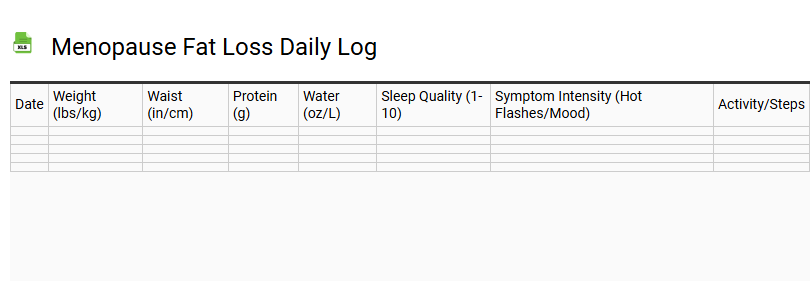
💾 Menopause Fat Loss Daily Log .xls
A menopause fat loss daily log serves as a vital instrument for navigating metabolic shifts during the perimenopause and postmenopause phases. Tracking daily variables helps manage hormonal weight gain by focusing on insulin sensitivity and cortisol regulation. By documenting protein intake, women can preserve lean muscle mass while targeting visceral adiposity. This structured record-keeping monitors caloric expenditure, sleep hygiene, and hydration levels, which are critical for stabilizing estrogen fluctuations. Emphasizing nutrient-dense whole foods and strength training intensity within the log ensures a holistic approach to midlife wellness. Consistent monitoring of menopause symptoms alongside macronutrient ratios empowers individuals to recalibrate their basal metabolic rate. Implementing this data-driven strategy facilitates sustainable fat loss, improves body composition, and mitigates the impact of hormonal imbalances on long-term health and vitality.
Hormonal Weight Trend Tracker
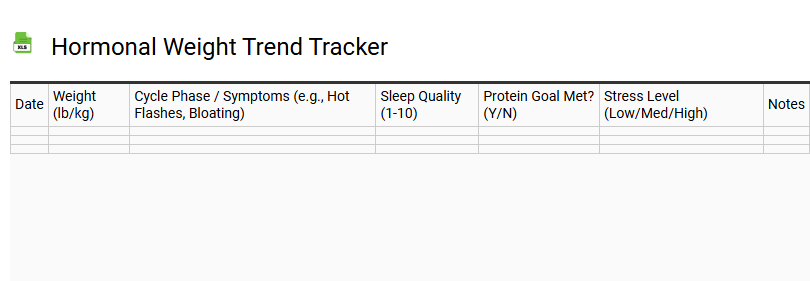
💾 Hormonal Weight Trend Tracker .xls
A Hormonal Weight Trend Tracker provides a comprehensive view of how internal physiological shifts influence body mass over time. Unlike standard logs that focus solely on caloric balance, this specialized template captures the intricate relationship between endocrine health and physical changes, helping you distinguish between temporary fluid retention and actual composition shifts.
- Cycle Phase Integration: Monitor weight relative to specific stages of your monthly rhythm to account for natural water retention.
- Stress and Sleep Correlation: Log cortisol-related factors and rest quality that directly impact metabolic efficiency.
- Symptom Mapping: Identify how energy levels, cravings, and mood align with specific weight fluctuations.
- Trend Visualization: Focus on moving averages rather than daily scale spikes to understand your unique metabolic baseline.
By documenting these variables, you gain clarity on your body's chemistry. This data-driven approach fosters a healthier perspective on progress by highlighting the natural ebb and flow of your system.
Visceral Fat and Waist Circumference Tracker
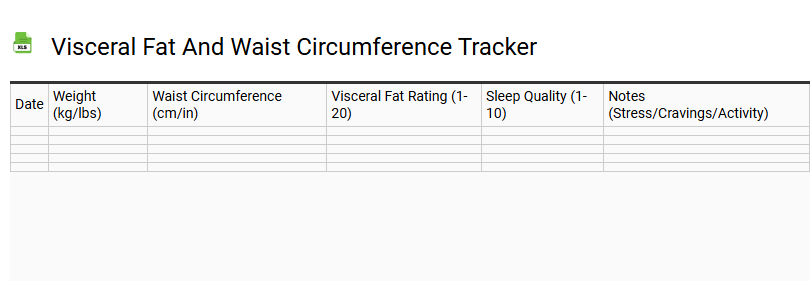
💾 Visceral Fat and Waist Circumference Tracker .xls
Monitoring your visceral fat and waist circumference is essential for assessing metabolic health and abdominal obesity. Unlike subcutaneous fat, visceral adipose tissue surrounds internal organs, significantly impacting cardiovascular disease risk and insulin sensitivity. This tracking template facilitates consistent body composition logging, offering more diagnostic value than BMI alone.
By recording regular measurements, users can identify trends in central adiposity and overall wellness. Effective tracking includes:
- Waist Measurement: Using a flexible tape measure to track midsection girth.
- Waist-to-Hip Ratio: A key indicator of metabolic syndrome risk.
- Progress Benchmarks: Visualizing the reduction of hidden belly fat over time.
Consistently updating this health tracker empowers individuals to make data-driven decisions regarding diet and exercise, ultimately reducing the likelihood of chronic lifestyle-related illnesses and improving long-term longevity.
Menopause Macro and Protein Intake Calculator
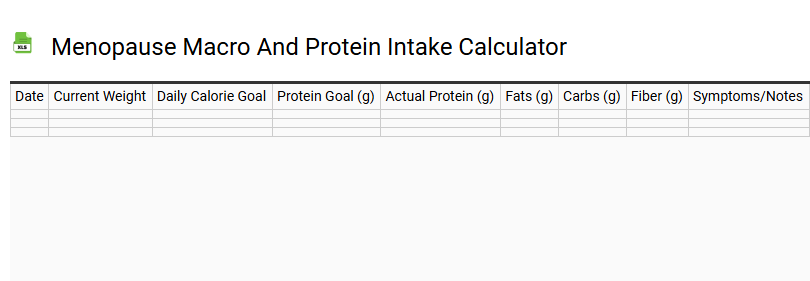
💾 Menopause Macro and Protein Intake Calculator .xls
Navigating perimenopause and postmenopause requires a targeted approach to nutrition. As estrogen levels decline, maintaining lean muscle mass becomes critical to prevent sarcopenia and support a healthy metabolic rate. This Menopause Macro and Protein Intake Calculator utilizes your Total Daily Energy Expenditure (TDEE) and basal metabolic rate (BMR) to provide customized macronutrient ratios.
Prioritizing a high protein distribution is essential for satiety, bone density, and enhancing the thermic effect of food. By balancing healthy fats and complex carbohydrates, you can stabilize blood sugar levels and manage visceral fat accumulation. This tool offers precise caloric requirements tailored to your activity level, ensuring your body composition remains optimal. Use these data-driven insights to adjust your daily nutritional intake, supporting hormonal balance and long-term vitality through every stage of the menopausal transition.
Body Composition and Muscle Mass Monitor
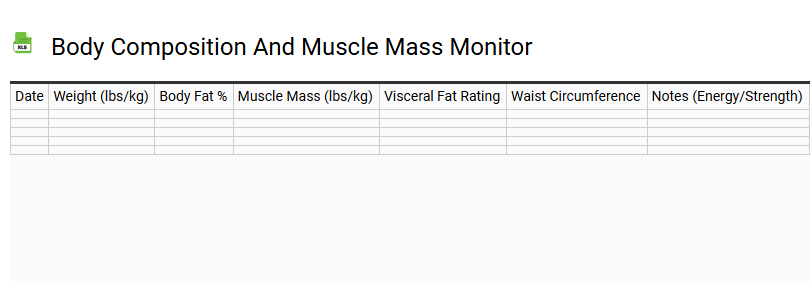
💾 Body Composition and Muscle Mass Monitor .xls
This high-precision body composition monitor utilizes advanced bioelectrical impedance analysis (BIA) technology to deliver a comprehensive assessment of physical health. Beyond basic weight tracking, it monitors critical metrics such as body fat percentage, skeletal muscle mass, and visceral fat levels. By analyzing hydration status, bone mass, and lean body mass, this integrated smart scale provides essential data for optimizing metabolic health.
Users can effectively track their basal metabolic rate (BMR) and BMI to tailor fitness routines and nutritional intake. Whether focusing on weight management or muscle hypertrophy, the professional-grade sensors offer accuracy for measuring subcutaneous fat and total body water. This sophisticated device is vital for those seeking a detailed metabolic profile and longitudinal biometric data to achieve long-term wellness and fitness goals.
Symptom and Fat Loss Correlation Dashboard
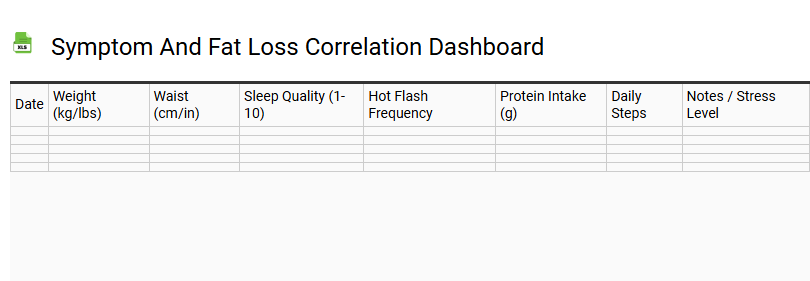
💾 Symptom and Fat Loss Correlation Dashboard .xls
The Symptom and Fat Loss Correlation Dashboard serves as a sophisticated analytical tool designed to bridge the gap between metabolic health and weight management. By monitoring physiological markers alongside caloric expenditure, users can identify how specific biofeedback signals-such as sleep quality, digestive efficiency, and systemic inflammation-directly impact their rate of fat oxidation and overall body composition.
This template facilitates a data-driven approach to wellness by highlighting patterns between:
- Hormonal balance and energy levels during a caloric deficit.
- Stress triggers and their effect on metabolic flexibility.
- Micronutrient intake and physiological recovery phases.
By visualizing these correlations, individuals can move beyond traditional scale metrics to understand the underlying biological variables affecting their fat loss journey. This holistic tracking ensures sustainable progress by optimizing cellular health and stabilizing the metabolic rate for long-term body recomposition success.
Menopause-Focused Meal and Weight Journal
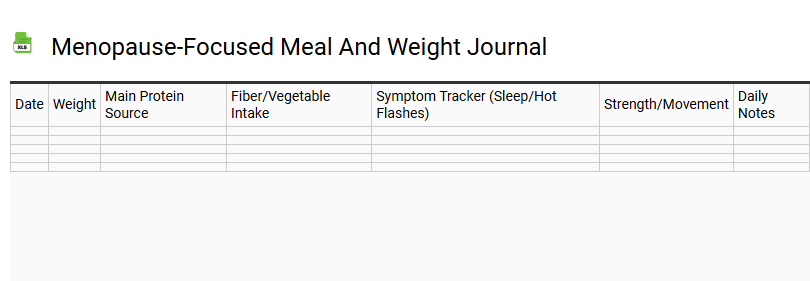
💾 Menopause-Focused Meal and Weight Journal .xls
A menopause-focused meal and weight journal serves as a strategic tool for navigating the physiological shifts of perimenopause and postmenopause. By documenting nutrient-dense foods, individuals can effectively manage hormonal weight gain and support metabolic health as estrogen levels fluctuate. This template prioritizes tracking macronutrient ratios, specifically increasing protein intake and fiber to maintain muscle mass and stabilize blood glucose.
Beyond caloric data, the journal emphasizes symptom logging to identify dietary triggers for hot flashes or sleep disruptions. Integrating mindful eating practices and monitoring hydration supports bone density and cardiovascular wellness. By consistently recording calcium and vitamin D consumption alongside daily activity, users gain actionable insights into their hormonal balance. This structured approach empowers women to adapt their lifestyle habits, fostering healthy aging and sustainable weight management during this significant biological transition.
Post-Menopausal Basal Metabolic Rate Tracker
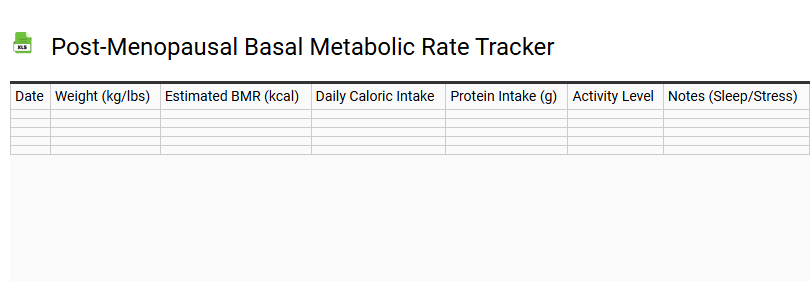
💾 Post-Menopausal Basal Metabolic Rate Tracker .xls
Managing weight during the post-menopausal transition requires precise monitoring of your basal metabolic rate (BMR). As estrogen levels decline, many women experience a noticeable metabolic slowdown and shifts in body composition. This specialized BMR tracker is designed to help you calculate resting energy expenditure (REE), accounting for age-related changes in lean muscle mass and hormonal balance.
By inputting consistent data into this health monitoring template, you can optimize your calorie expenditure and tailor your nutritional intake to your body's evolving needs. Utilizing a dedicated metabolic tracking tool empowers you to navigate midlife wellness with data-driven insights. Focus on maintaining metabolic health by monitoring these key factors:
- Daily resting calories burned.
- Impact of hormone replacement therapy on energy.
- Correlation between activity levels and metabolic efficiency.
Resistance Training and Fat Loss Progress Chart
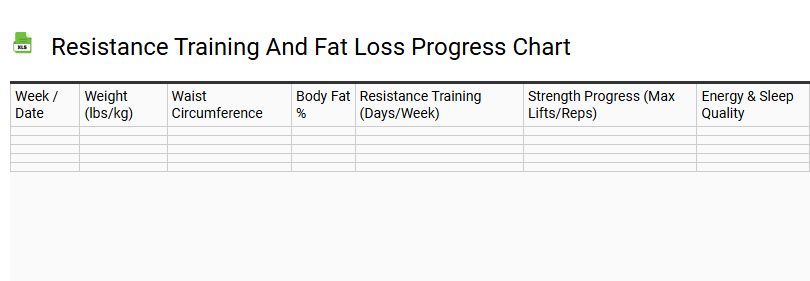
💾 Resistance Training and Fat Loss Progress Chart .xls
Sleep and Cortisol-Driven Weight Tracker
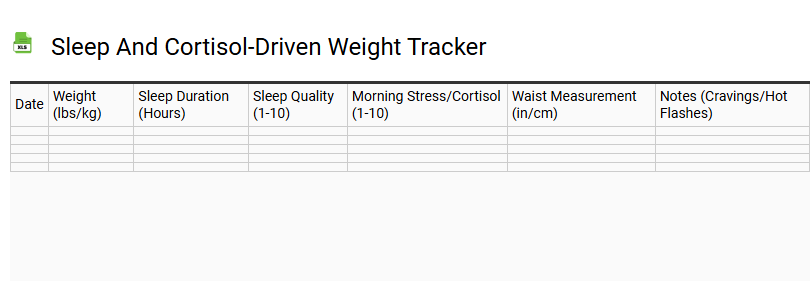
💾 Sleep and Cortisol-Driven Weight Tracker .xls
Optimize your metabolic health by monitoring the critical synergy between restorative sleep cycles and hormonal regulation. This template tracks daily biometric data to reveal how circadian rhythm disruptions influence cortisol levels, a primary driver of abdominal fat storage and insulin resistance. By documenting sleep duration alongside morning stress markers, users can visualize the direct correlation between sleep hygiene and sustainable weight management.
Utilizing this data-driven tool facilitates better adrenal health management and supports balanced metabolic function. Precise tracking of these physiological variables helps identify patterns in hormonal balance that impact appetite regulation and energy expenditure. Empower your wellness journey with actionable insights into how stress reduction and optimized recovery phases stabilize body composition, improve metabolic flexibility, and enhance overall vitality through comprehensive health monitoring and longitudinal data analysis.
Estrogen-Optimization Nutrition Log
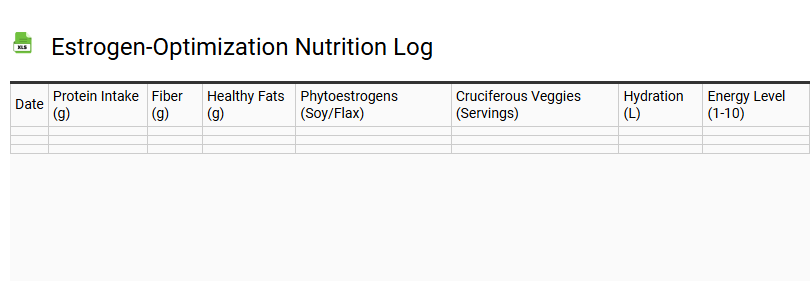
💾 Estrogen-Optimization Nutrition Log .xls
This estrogen-optimization nutrition log serves as a comprehensive tool for tracking dietary habits aimed at achieving hormonal balance and endocrine health. By meticulously documenting daily intake, users can monitor the consumption of cruciferous vegetables, high-fiber foods, and healthy fats essential for supporting liver detoxification and efficient estrogen metabolism.
- Track phytoestrogen sources like flaxseeds to modulate receptor activity.
- Monitor fiber intake to support the gut microbiome and the excretion of hormone metabolites.
- Identify and minimize exposure to xenoestrogens and endocrine disruptors.
- Log micronutrient density to assist phase I and phase II detoxification pathways.
Maintaining this log facilitates a data-driven approach to hormonal equilibrium, allowing for precise adjustments to nutritional strategies. By correlating food choices with physiological symptoms, individuals can optimize their metabolic vitality and long-term endocrine stability through targeted, evidence-based nutrition.
Menopause Habit and Weight Loss Streak Tracker
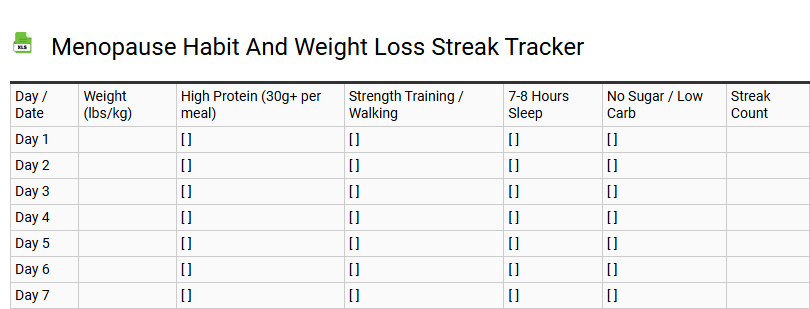
💾 Menopause Habit and Weight Loss Streak Tracker .xls
Navigating weight management during menopause and perimenopause requires a dedicated focus on metabolic health and hormonal balance. This streak tracker template is designed to help women maintain consistency in daily routines, effectively addressing the estrogen fluctuations and insulin resistance that often contribute to midlife weight gain.
By monitoring daily habits, users can foster long-term behavioral change and support fat loss through these essential pillars:
- Daily protein intake to support muscle mass preservation.
- Tracking resistance training sessions to boost basal metabolic rate.
- Monitoring sleep hygiene and cortisol regulation for stress reduction.
- Ensuring adequate hydration and fiber consumption for digestive health.
A visual habit tracker provides the accountability needed to overcome stubborn visceral fat. Maintaining a daily streak transforms complex midlife wellness goals into sustainable, health-focused rituals.
Monthly Hormone and Weight Shift Analyzer
💾 Monthly Hormone and Weight Shift Analyzer .xls
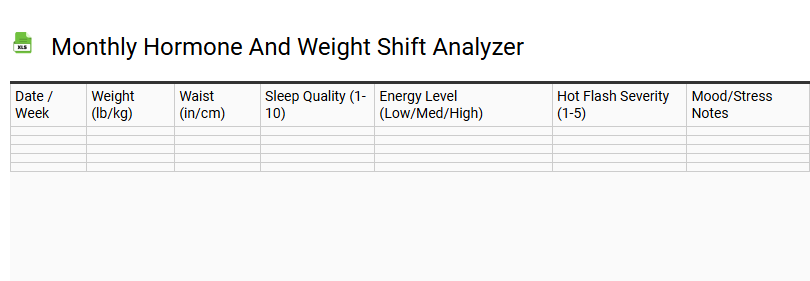
The Monthly Hormone and Weight Shift Analyzer serves as a sophisticated wellness dashboard designed to synchronize menstrual cycle tracking with body composition metrics. By monitoring hormonal fluctuations-specifically the interplay between estrogen and progesterone-users can differentiate between adipose tissue changes and temporary fluid retention or water weight shifts. Throughout the follicular phase and luteal phase, significant variations in metabolic rate and basal body temperature often influence scale readings.
This tool leverages endocrine health data to provide insights into reproductive health and fitness optimization. By analyzing daily data, individuals gain a granular understanding of how their endocrine system dictates energy levels and appetite. This template transforms raw data into actionable intelligence, allowing for precise nutritional adjustments and effective long-term weight management while maintaining hormonal balance.
Intermittent Fasting for Menopause Tracker
💾 Intermittent Fasting for Menopause Tracker .xls
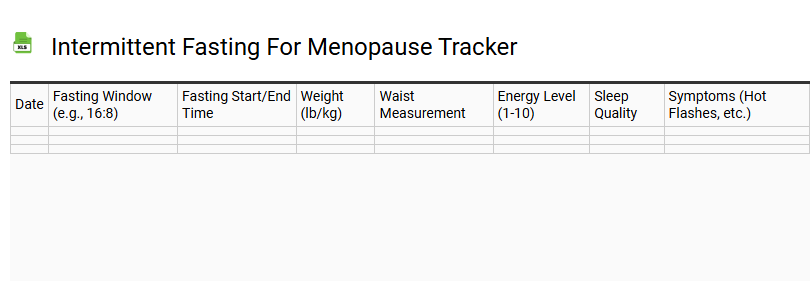
This intermittent fasting for menopause tracker serves as a comprehensive tool for navigating hormonal shifts during perimenopause and postmenopause. By monitoring specific fasting windows, such as the 16:8 protocol or crescendo method, users can effectively optimize metabolic health and improve insulin sensitivity.
The template allows for precise logging of daily symptoms, including hot flashes, night sweats, and brain fog, correlating them with caloric timing and autophagy. Tracking these variables helps manage estrogen decline and cortisol levels, which are critical for reducing visceral fat and maintaining lean muscle mass.
By documenting nutrient-dense meals and sleep quality alongside fasting durations, women achieve greater bio-individuality in their wellness journey. This data-driven approach to weight management ensures sustainable metabolic flexibility, supporting long-term health and vitality throughout the menopausal transition.
Strength-to-Weight Ratio Progress Sheet
💾 Strength-to-Weight Ratio Progress Sheet .xls
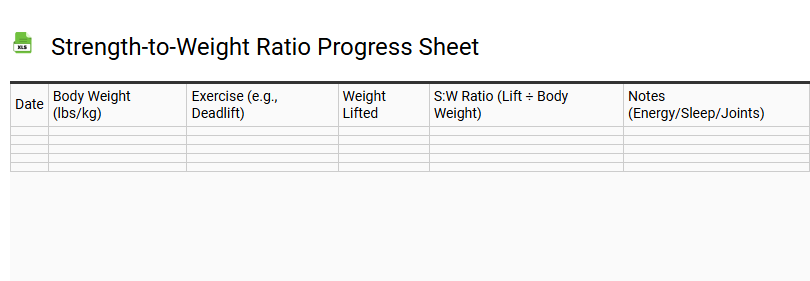
A Strength-to-Weight Ratio Progress Sheet is an essential tool for athletes focused on relative strength and physical optimization. By monitoring the relationship between body mass and lifting capacity, this template helps track power-to-weight metrics across various resistance training disciplines. Utilizing a structured gym log allows for the precise evaluation of body composition changes alongside progressive overload strategies. Key benefits include:
- Monitoring functional fitness gains.
- Analyzing athletic performance trends.
- Optimizing lean muscle mass efficiency.
- Identifying plateaus in absolute strength.
Consistent data entry ensures that your metabolic rate and neuromuscular adaptation are aligned with specific fitness objectives. High-performance training relies on this synergy to improve speed-to-power ratios, ensuring every pound of body weight contributes to peak output and mechanical efficiency during intense physical exertion.
A menopause fat loss tracker serves as an essential resource for effective midlife weight management. By monitoring body composition, fluctuating estrogen levels, and metabolic health, women can better navigate hormonal changes. This specialized template helps record caloric deficits, protein goals, and cortisol triggers that influence abdominal fat. Utilizing a structured fitness log empowers you to reclaim health during this transition. Implementing this tracking system ensures sustainable progress, helping you optimize hormonal balance and achieve long-term vitality through data-driven wellness strategies.