
Monthly Pressure Trend Chart Template for Data Tracking and Analysis
Efficiently tracking physiological data requires a robust Monthly Pressure Trend Chart. This specialized reporting tool simplifies the process of monitoring daily fluctuations and long-term health metrics. By utilizing a structured layout, users can visualize critical patterns and identify significant anomalies over a thirty-day period.
Whether for clinical documentation or personal wellness, this dashboard provides clear insights into vital trends through precise data visualization. Please check our diverse collection of already made variations of templates below.
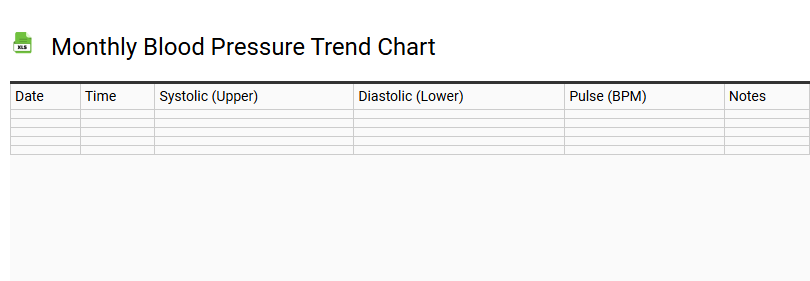
Monthly Blood Pressure Trend Chart
💾 Monthly Blood Pressure Trend Chart .xls
A monthly blood pressure trend chart serves as a vital diagnostic tool for monitoring cardiovascular health and tracking systolic and diastolic fluctuations. Utilizing a structured tracking log allows patients to record daily sphygmomanometer readings, capturing essential data points like heart rate and pulse pressure. This systematic medical record helps identify patterns related to hypertension or hypotension, providing clinical insights for healthcare providers.
By documenting consistent health data within this template, users can visualize arterial pressure trends through graphical representations. This proactive approach to vital sign monitoring assists in evaluating the efficacy of lifestyle changes or medications. Maintaining a detailed blood pressure diary ensures a clear baseline, facilitating early detection of circulatory irregularities and supporting long-term wellness management through precise, organized data logging.
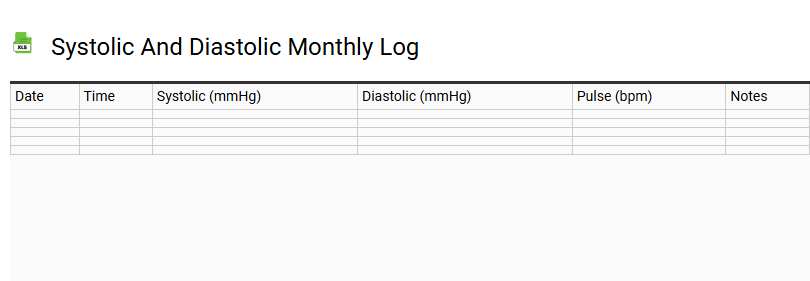
Systolic and Diastolic Monthly Log
💾 Systolic and Diastolic Monthly Log .xls
A systolic and diastolic monthly log serves as a vital tool for hypertension management and proactive cardiovascular health monitoring. This structured template enables users to document daily readings, capturing the precise arterial pressure exerted during heart contractions and resting phases. By maintaining a consistent health journal, individuals can track circulatory system trends and fluctuations over time.
Key benefits of utilizing this clinical record include:
- Identification of hypertension or hypotension patterns.
- Accurate medical records for physician consultations.
- Monitoring heart rate and pulse pressure variability.
- Evaluating the efficacy of lifestyle adjustments or sphygmomanometer accuracy.
Systematic blood pressure monitoring ensures data-driven insights into your vascular health, facilitating timely medical interventions and long-term wellness oversight.
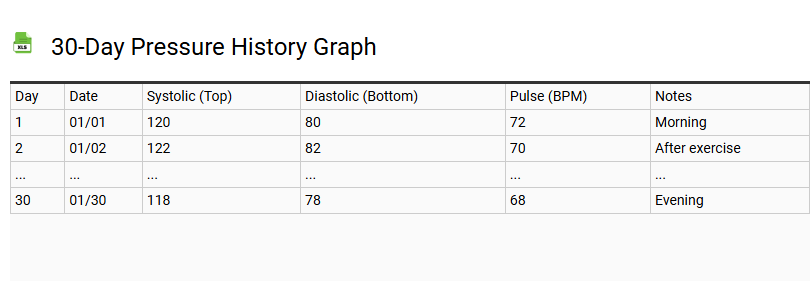
30-Day Pressure History Graph
💾 30-Day Pressure History Graph .xls
This interface component displays a comprehensive visualization of pressure readings recorded over a thirty-day duration. It utilizes a structured layout to plot daily fluctuations, enabling users to observe long-term trends and sudden deviations in atmospheric or system measurements.
The tracking module includes several essential elements for data clarity:
- Temporal Range: A horizontal axis representing a full month of continuous monitoring and data collection.
- Metric Distribution: A vertical scale that maps precise units to ensure accurate comparative analysis.
- Visual Progression: A graphical line that highlights peak values, low points, and general stability patterns.
The design transforms complex numerical logs into an intuitive format, supporting informed decisions based on historical performance. This layout is ideal for dashboards where longitudinal data accuracy and clear trend identification are primary requirements for the user experience.
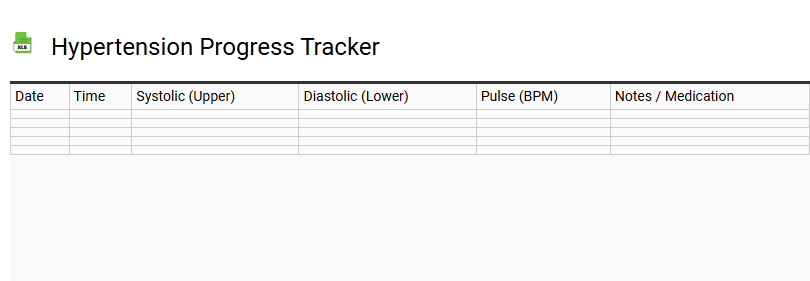
Hypertension Progress Tracker
💾 Hypertension Progress Tracker .xls
A hypertension progress tracker is an essential instrument for proactive blood pressure monitoring and long-term cardiovascular health management. This structured template allows users to systematically record systolic and diastolic readings, providing a clear overview of arterial pressure fluctuations. By maintaining a detailed digital health journal, individuals can track pulse rate, identify hypertension triggers, and observe how lifestyle adjustments impact their vascular wellness.
Consistent data entry into this medical records log facilitates informed consultations with healthcare providers, aiding in the prevention of a hypertensive crisis. Monitoring circadian rhythm impacts on blood pressure levels ensures comprehensive chronic disease oversight. This biometric data tool simplifies the visualization of heart health trends, empowering patients to manage primary hypertension through accurate, longitudinal health documentation and regular sphygmomanometer checks.
Automated Vitals Trend Dashboard
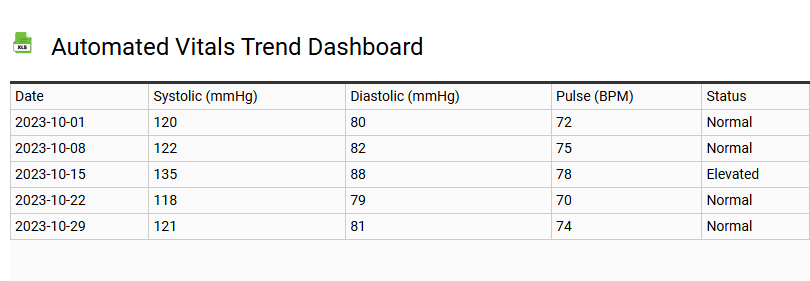
💾 Automated Vitals Trend Dashboard .xls
This Automated Vitals Trend Dashboard provides a sophisticated solution for real-time patient monitoring and advanced data visualization. By centralizing critical physiological parameters such as heart rate, blood pressure, and oxygen saturation, clinicians can track longitudinal health metrics through intuitive graphical interfaces.
The platform leverages seamless EHR integration to streamline clinical workflows, ensuring biometric tracking is both accurate and instantly accessible. Utilizing predictive analytics, the system identifies subtle deviations in patient stability, offering actionable clinical decision support to improve medical outcomes.
This remote patient monitoring tool facilitates early intervention by transforming raw telemetry data into meaningful data-driven insights. Designed for high-acuity environments, the dashboard enhances diagnostic precision while reducing manual documentation errors, ensuring comprehensive oversight through automated trend analysis and synchronized health informatics.
Monthly BP Range Visualization
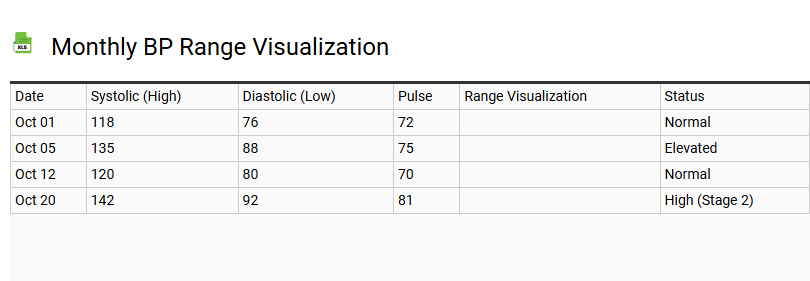
💾 Monthly BP Range Visualization .xls
This monthly blood pressure range visualization template provides a clear graphical representation of cardiovascular health trends over a thirty-day period. By mapping daily systolic and diastolic measurements, the tool highlights fluctuations and identifies peaks or troughs that may require medical attention. The layout typically features color-coded zones to distinguish between normal, elevated, and hypertensive stages, making complex physiological data immediately accessible.
Users can easily track the impact of lifestyle changes or medication adjustments through visual continuity. This organized structure ensures that both patients and healthcare providers can monitor stability and detect irregular patterns early. By centralizing vital signs into a single intuitive interface, the template simplifies health management and promotes consistent monitoring for long-term heart wellness and effective data interpretation.
Cardiovascular Health Trend Report
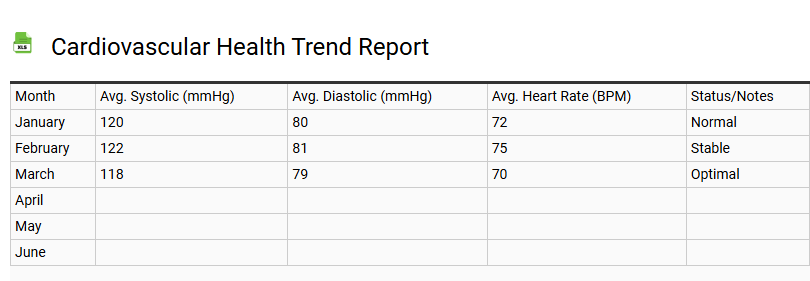
💾 Cardiovascular Health Trend Report .xls
This cardiovascular health trend report provides a sophisticated framework for evaluating longitudinal cardiac performance and patient wellness. By integrating remote patient monitoring (RPM) data with clinical observations, practitioners can track critical biomarkers such as blood pressure variability, heart rate fluctuations, and lipid profiles. This template prioritizes preventive cardiology, enabling healthcare providers to identify early indicators of hypertension and arrhythmia through wearable health technology integration.
Utilizing data-driven insights, the report facilitates stroke prevention and proactive chronic disease management. It streamlines the visualization of cardiovascular risk factors, ensuring precise clinical documentation and improved patient outcomes. By focusing on digital therapeutics and telehealth metrics, this template serves as an essential tool for modern cardiology practices aiming for comprehensive, evidence-based heart health monitoring and personalized intervention strategies.
Morning vs Evening Pressure Chart
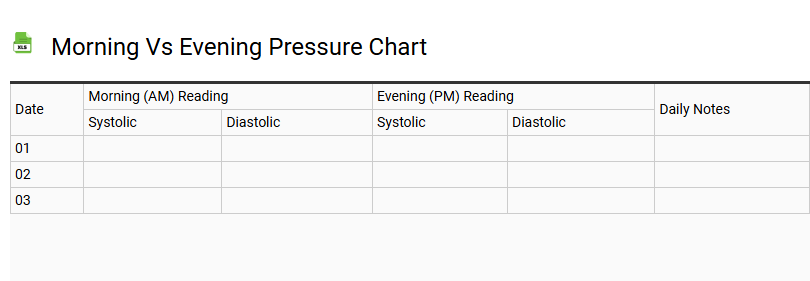
💾 Morning vs Evening Pressure Chart .xls
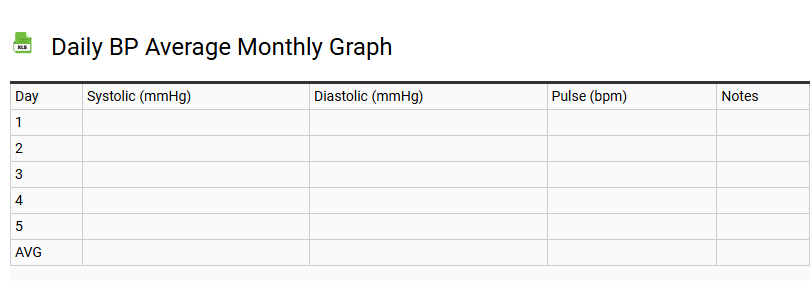
Daily BP Average Monthly Graph
💾 Daily BP Average Monthly Graph .xls
A Daily BP Average Monthly Graph template serves as a critical diagnostic tool for monitoring cardiovascular health. By systematically recording systolic and diastolic readings, users can visualize blood pressure fluctuations over a four-week duration. This data visualization assists in identifying hypertension trends and evaluating the efficacy of antihypertensive medication.
This medical log integrates mean arterial pressure data points to provide a comprehensive overview of circadian rhythms and heart rate variability. Utilizing a graphical representation simplifies the interpretation of complex clinical metrics for patients and healthcare providers. Key benefits include:
- Tracking pulse pressure deviations and vascular health.
- Analyzing longitudinal data plotting for accurate medical records.
- Enhancing patient compliance through visual feedback.
Consolidating regular sphygmomanometer readings into an analytical chart empowers proactive wellness management and stroke prevention strategies by highlighting significant hypertensive patterns over time.
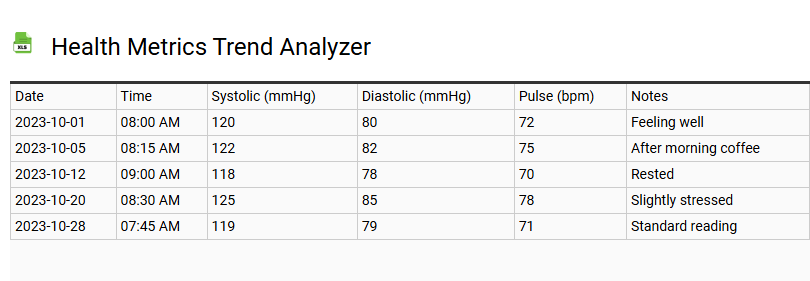
Health Metrics Trend Analyzer
💾 Health Metrics Trend Analyzer .xls
The Health Metrics Trend Analyzer functions as a sophisticated biometric data dashboard designed for seamless vital signs tracking. By utilizing advanced data visualization, this template performs a comprehensive longitudinal analysis of critical physiological indicators. It empowers users to identify subtle wellness patterns and health informatics, facilitating proactive chronic condition management.
Through predictive analytics and detailed medical reporting, the analyzer transforms raw fitness metrics into actionable diagnostic insights. This tool supports data-driven decisions regarding preventative care by monitoring fluctuations in resting heart rate, blood pressure, and metabolic rates. By centralizing a biometric profile, it bridges the gap between biological data and personalized health optimization, ensuring long-term lifestyle adjustments are backed by quantifiable evidence and real-time monitoring.
This comprehensive Monthly Pressure Trend Chart template empowers users to monitor blood pressure fluctuations with precision. By recording daily systolic and diastolic readings, you gain invaluable insights into your cardiovascular health and long-term hypertension management. This data visualization tool simplifies tracking health metrics, ensuring consistent medical documentation for physician consultations. Utilizing a structured digital log or printable tracker fosters proactive wellness. Start visualizing your arterial trends today to maintain optimal heart health through organized, longitudinal data analysis.