
PCOS Ovulation and Insulin Resistance Tracking Template
Effectively managing Polycystic Ovary Syndrome requires precise monitoring of metabolic health and reproductive cycles. Utilizing a PCOS ovulation and insulin log helps track insulin resistance, blood glucose levels, and hormonal balance. By documenting basal body temperature and cycle patterns, you can gain insights into fertility and metabolic wellness. This data-driven approach is essential for optimizing conception chances and overall symptom management. We invite you to explore the various professionally designed template variations provided below.
Daily PCOS Symptom Log
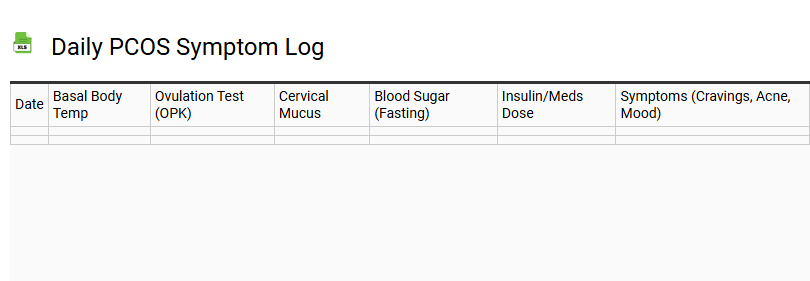
A daily PCOS symptom log serves as a vital tool for monitoring hormonal health and identifying personal patterns. By recording specific physical and emotional changes, you create a comprehensive record of how polycystic ovary syndrome affects your body throughout each cycle. This data helps healthcare providers tailor treatments to your unique needs.
Effective tracking should include:
- Cycle Fluctuations: Note period regularity, flow intensity, and any mid-cycle spotting.
- Physical Indicators: Document skin health, such as acne or hirsutism, and changes in hair texture.
- Energy and Mood: Track daily fatigue levels, sleep quality, and shifts in emotional well-being.
- Metabolic Signs: Record food cravings, digestive comfort, and signs of insulin sensitivity.
Consistent documentation reveals correlations between lifestyle choices and symptom severity, empowering you to manage your health with precision and clarity.
Basal Body Temperature BBT Chart
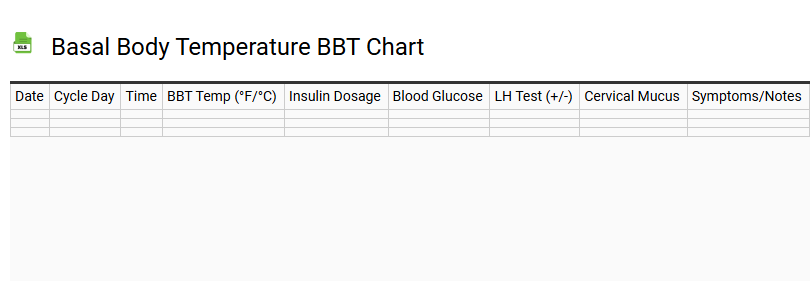
💾 Basal Body Temperature BBT Chart .xls
A Basal Body Temperature (BBT) chart serves as a foundational tool for fertility awareness methods and ovulation tracking. By recording your waking temperature daily with a precise digital thermometer, you can visualize the biphasic pattern of your menstrual cycle. This template allows users to identify the thermal shift-a sustained rise in temperature indicating that progesterone has been released following ovulation. Monitoring the transition from the follicular phase to the luteal phase helps pinpoint the fertile window, optimizing the timing for conception or supporting natural family planning. Consistent data entry highlights the nadir and subsequent temperature spike, offering clinical insights into reproductive health and cycle regularity. Whether utilizing a digital spreadsheet or a printable log, tracking these physiological markers is essential for understanding hormonal fluctuations and predicting your next period accurately.
Menstrual Cycle and Ovulation Tracker
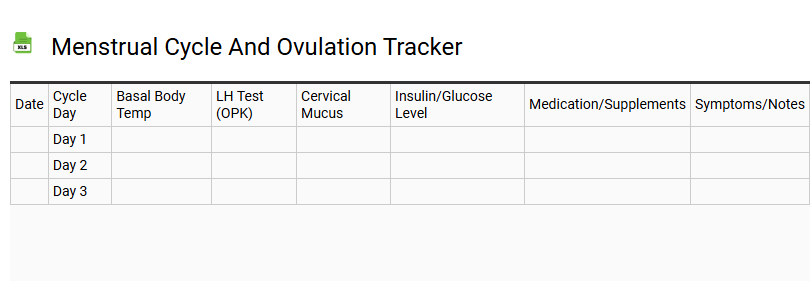
💾 Menstrual Cycle and Ovulation Tracker .xls
Optimizing reproductive health requires a detailed menstrual cycle and ovulation tracker to monitor physiological shifts. This template facilitates the precise logging of period dates, cycle length, and PMS symptoms, providing a clear overview of your monthly cycle. By recording basal body temperature and cervical mucus consistency, users can accurately identify their fertile window and ovulation day.
Understanding the transitions between the follicular phase and the luteal phase is essential for both conception planning and natural contraception. This digital calendar tracks hormone levels and menstruation patterns, empowering individuals with data-driven insights into their reproductive health. Whether you are monitoring fertility window indicators or hormonal fluctuations, this structured approach ensures comprehensive wellness tracking and better lifestyle synchronization through every stage of your cycle.
Insulin Resistance Glucose Log
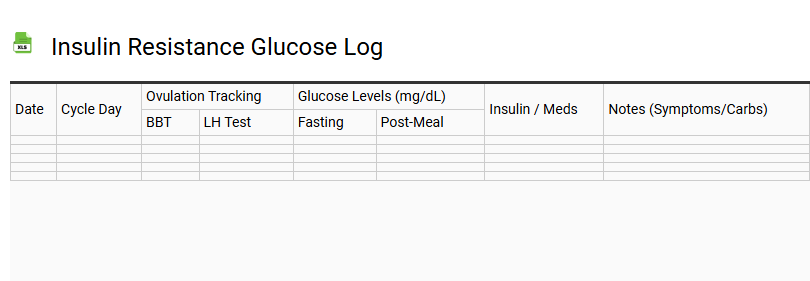
💾 Insulin Resistance Glucose Log .xls
Managing insulin resistance effectively requires a data-driven approach to monitor blood glucose levels and identify patterns in metabolic health. A structured glucose log serves as an essential tool for tracking glycemic variability and hyperinsulinemia, helping individuals understand their unique carbohydrate sensitivity.
To optimize glycemic control, the template should record:
- Fasting blood sugar readings to establish a morning baseline.
- Postprandial glucose levels to measure the insulin response after meals.
- Daily carbohydrate intake and macronutrient ratios.
- Physical activity duration and its impact on insulin sensitivity.
Consistently logging these metrics assists in lowering HbA1c results and mitigating type 2 diabetes risks. By analyzing these data points, users can implement precise lifestyle interventions and dietary adjustments to restore endocrine balance and improve overall metabolic flexibility.
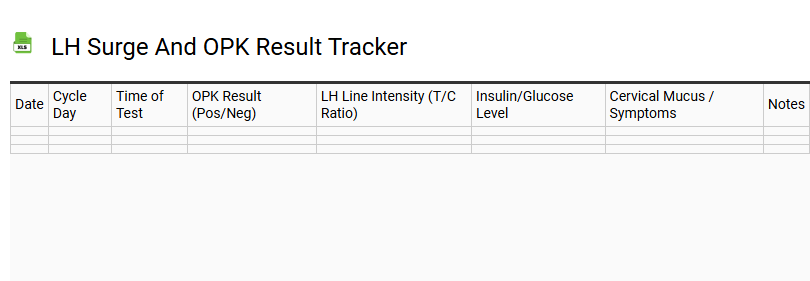
LH Surge and OPK Result Tracker
💾 LH Surge and OPK Result Tracker .xls
An efficient LH Surge and OPK Result Tracker is an essential tool for monitoring reproductive health and identifying your peak fertility window. By systematically logging Luteinizing Hormone fluctuations via ovulation predictor kits (OPK), users can pinpoint the hormonal surge that precedes egg release. This template allows for the precise documentation of test line intensity, helping to differentiate between low, high, and peak readings.
Integrating these urine metabolite data points with basal body temperature (BBT) readings provides a comprehensive view of the menstrual cycle. Tracking these hormonal markers optimizes the timing for conception by identifying the most fertile window. Whether using analog test strips or digital readers, a structured log ensures accurate ovulation prediction, enhancing your journey toward successful fertilization through data-driven cycle tracking and hormonal mapping.
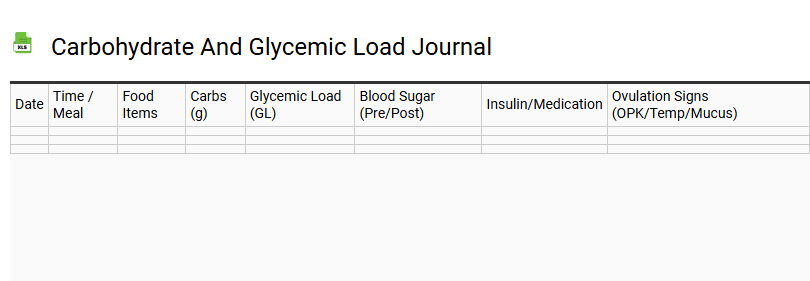
Carbohydrate and Glycemic Load Journal
💾 Carbohydrate and Glycemic Load Journal .xls
Monitoring dietary intake through a Carbohydrate and Glycemic Load Journal is vital for regulating blood glucose levels and managing insulin sensitivity. This structured template facilitates precise tracking of total carbohydrates, dietary fiber, and net carbs, offering a comprehensive view of daily nutritional patterns.
By recording the Glycemic Index (GI) and calculating the Glycemic Load (GL) for every meal, individuals can effectively predict postprandial glucose spikes and optimize metabolic health. Whether utilized for diabetic management, weight loss, or athletic performance, documenting macronutrient distribution and portion sizes ensures stable energy levels. Consistent logging of complex carbohydrates and simple sugars empowers users to make informed dietary choices, improving long-term glycemic control and overall wellness through data-driven meal planning and glucose monitoring.
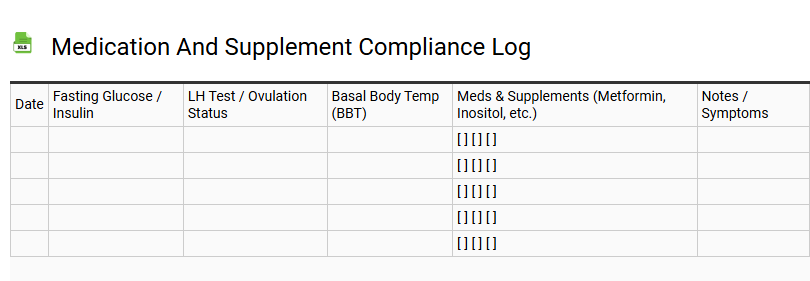
Medication and Supplement Compliance Log
💾 Medication and Supplement Compliance Log .xls
A comprehensive medication and supplement compliance log serves as a vital tool for effective health management and prescription adherence. By meticulously documenting your daily dosage schedule, you ensure consistent therapeutic outcomes while minimizing the risk of missed doses or adverse drug interactions.
This tracking template facilitates clear communication with your healthcare provider by recording essential data points:
- Medication name and supplemental strength.
- Exact dosage timing and administration frequency.
- Observations on symptom relief or potential side effects.
- Refill reminders to maintain a continuous wellness routine.
Utilizing a digital health log or printable pill tracker empowers patients to manage their treatment plan accurately, optimizing nutrient intake and long-term patient safety through organized medical history documentation.
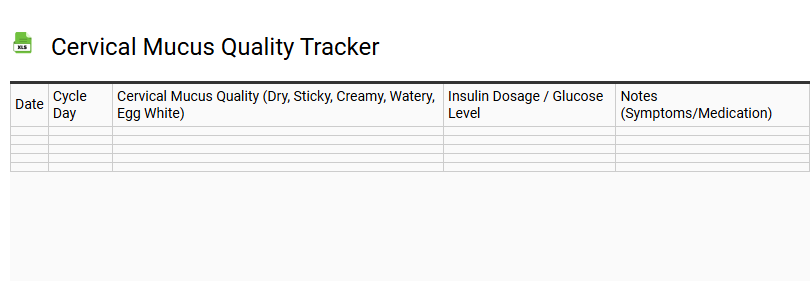
Cervical Mucus Quality Tracker
💾 Cervical Mucus Quality Tracker .xls
A cervical mucus quality tracker is an essential tool for monitoring the menstrual cycle and identifying the fertile window. By documenting daily variations in vaginal discharge, users can observe critical hormonal shifts, specifically the rise in estrogen levels. This template helps categorize fluid textures-ranging from dry or sticky to creamy, watery, and egg white cervical mucus (EWCM).
Consistent cycle charting assists in predicting ovulation and optimizing the timing for conception. When combined with basal body temperature (BBT) readings, this data provides a clear overview of the follicular phase and luteal phase. Utilizing this structured log empowers individuals to track their reproductive health accurately, distinguishing between non-fertile days and peak fertility using established techniques like the Billings Method. Precise documentation ensures you recognize the body's natural biological markers during every cycle.
Weight and Waist-to-Hip Ratio Chart
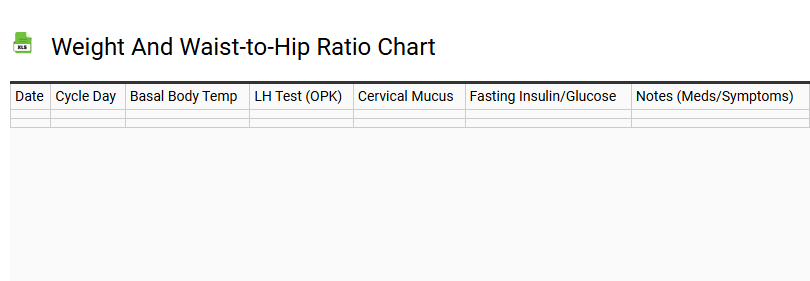
💾 Weight and Waist-to-Hip Ratio Chart .xls
A Weight and Waist-to-Hip Ratio Chart serves as a comprehensive tool for monitoring body composition and metabolic health. While standard scales measure total mass, tracking the relationship between your waist and hips provides deeper insights into fat distribution.
This template allows users to record and analyze several vital metrics:
- Body Weight: Consistent tracking to observe overall fluctuations and trends.
- Waist Circumference: Measured at the narrowest point of the torso.
- Hip Circumference: Measured at the widest part of the buttocks.
- Calculated Ratio: The specific quotient used to identify potential health risks.
By documenting these figures regularly, individuals can visualize progress beyond a single number. This structured approach helps in identifying shifts in abdominal adiposity, which is often linked to long-term wellness. Using this data-driven log ensures a more holistic view of physical transformations and cardiovascular health markers.
Hirsutism and Acne Severity Tracker
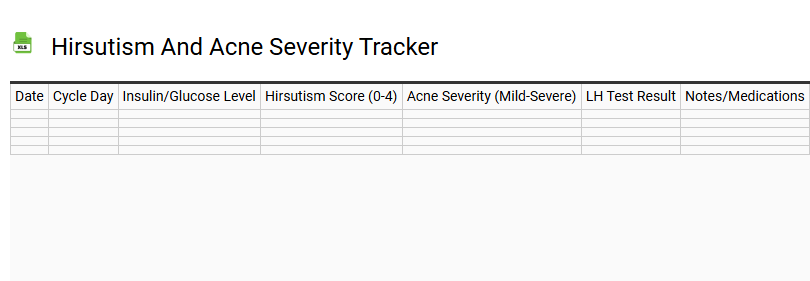
💾 Hirsutism and Acne Severity Tracker .xls
This Hirsutism and Acne Severity Tracker provides a systematic framework for monitoring androgen-related symptoms and hormonal health indicators. By utilizing clinical metrics like the Ferriman-Gallwey scale, users can objectively document excess terminal hair growth patterns and density variations. This template integrates dermatological monitoring for skin clarity, focusing on sebum production, inflammatory lesion counts, and cystic acne progression.
Ideal for those managing Polycystic Ovary Syndrome (PCOS) or endocrine sensitivities, the tracker correlates symptom flare-ups with the menstrual cycle. Logging these fluctuations aids in identifying triggers for hyperandrogenism and assessing the efficacy of medical treatments or lifestyle interventions. Precise data on follicular health and facial hair distribution empowers patients during consultations, ensuring a comprehensive overview of hormonal imbalance symptoms. Use this data-driven approach to bridge the gap between daily observations and clinical insights for improved long-term symptom management.
Post-Prandial Blood Sugar Monitor
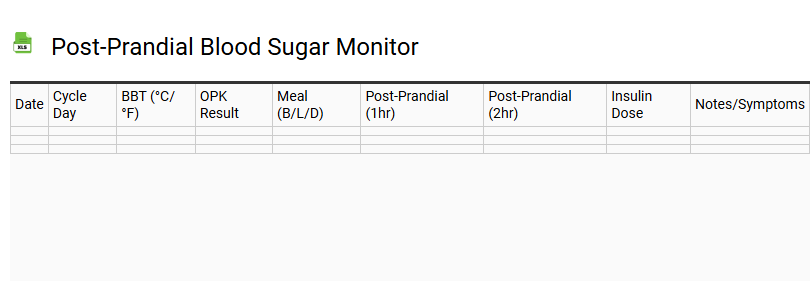
💾 Post-Prandial Blood Sugar Monitor .xls
This post-prandial blood sugar monitor template is designed to track blood glucose levels following meal consumption, a critical metric for effective diabetes management. By documenting values during the recommended two-hour testing window, users can accurately observe their glycemic response and identify potential glucose spikes triggered by specific foods.
Consistent mealtime tracking is essential for evaluating insulin sensitivity and preventing prolonged hyperglycemia. Maintaining readings within a personalized target range supports long-term metabolic health and cardiovascular wellness. This structured log facilitates data-driven adjustments to diet, exercise, and medication protocols. Whether managing Type 2 diabetes or monitoring glycemic control during pregnancy, this tool provides the clinical insights necessary to optimize blood sugar regulation and improve overall patient outcomes through precise, actionable health data.
Sleep and Energy Level Diary
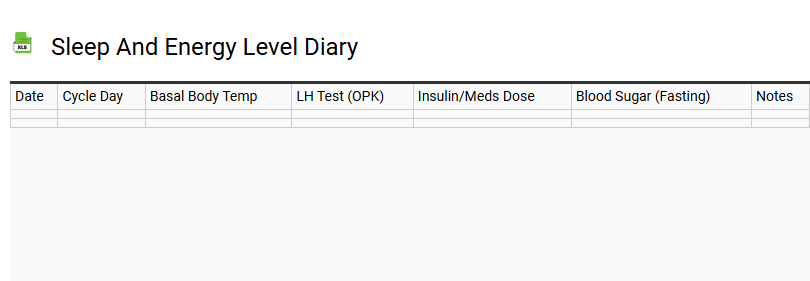
💾 Sleep and Energy Level Diary .xls
A comprehensive Sleep and Energy Level Diary serves as a strategic tool for monitoring your circadian rhythm and identifying critical patterns in restorative rest. By consistently logging sleep duration, sleep quality, and fluctuating fatigue levels, individuals can uncover the direct correlation between nocturnal habits and daytime alertness. This template facilitates tracking sleep hygiene variables, such as blue light exposure and caffeine consumption, which significantly influence melatonin production and REM cycle consistency.
Utilizing this data-driven approach helps optimize cognitive function and overall physical vitality. Detailed entries regarding wakefulness and mid-day energy dips allow for precise adjustments to lifestyle behaviors, effectively mitigating chronic exhaustion. Whether aiming to improve sleep latency or maximize metabolic health, a structured diary provides the biometric insights needed to harmonize your internal clock and achieve peak performance through evidence-based self-regulation.
Physical Activity and Metformin Log
💾 Physical Activity and Metformin Log .xls
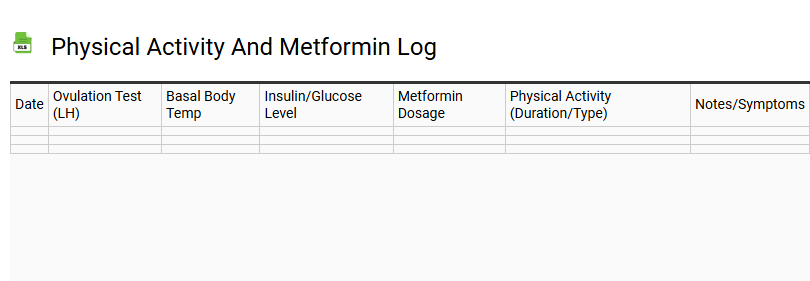
A Physical Activity and Metformin Log serves as a vital clinical tool for managing type 2 diabetes and enhancing insulin sensitivity. By documenting daily exercise routines alongside medication adherence, users gain valuable insights into the synergy between physical exertion and glycemic control. This template facilitates precise blood sugar monitoring by tracking aerobic sessions, resistance training, and specific metformin dosage timing. Consistent data entry helps identify fluctuations in glucose levels, ensuring proactive metabolic health management. Utilizing this lifestyle intervention strategy allows for better communication with healthcare providers regarding your diabetes management plan. Integrating cardiovascular health metrics with pharmacological tracking provides a comprehensive overview of your wellness journey, promoting long-term stability and optimized physiological responses to your treatment protocol. Effective tracking supports weight management goals and improves overall endocrine function through disciplined monitoring.
Mood and Hormonal Change Journal
💾 Mood and Hormonal Change Journal .xls
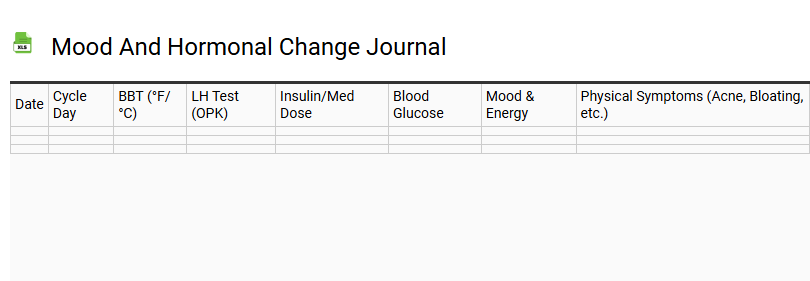
A dedicated mood and hormonal change journal serves as a vital diagnostic tool for tracking emotional fluctuations and physiological symptoms linked to endocrine health. By documenting daily energy levels, irritability, and anxiety alongside menstrual cycle phases or menopause progression, users can identify significant patterns in estrogen and progesterone shifts. This logging process enhances self-awareness regarding PMS, ovulation, and perimenopause, facilitating better communication with healthcare providers.
Integrating wellness metrics like sleep quality, stress triggers, and libido into your logs provides a holistic view of reproductive health and hormonal balance. Whether managing monthly cycles or navigating life transitions, consistent record-keeping empowers individuals to reclaim control over their mental health and physical well-being through data-driven insights. Utilizing a structured template ensures that subtle hormonal imbalances are caught early, promoting long-term endocrine stability and emotional resilience.
Food Sensitivity and Bloating Tracker
💾 Food Sensitivity and Bloating Tracker .xls
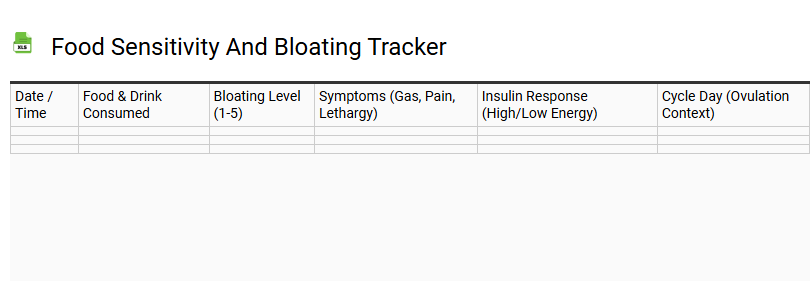
This Food Sensitivity and Bloating Tracker serves as a comprehensive tool for optimizing digestive health. By maintaining a detailed food diary, individuals can effectively identify trigger foods that cause abdominal distension, gas, and gastrointestinal discomfort. This template is specifically designed to support an elimination diet, allowing users to pinpoint food intolerances and sensitivities such as gluten, dairy, or high-FODMAP ingredients.
- Log daily nutritional intake and meal timing.
- Monitor symptom severity and bowel movements.
- Track gut flora reactions and potential inflammatory responses.
- Identify correlations between microbiome health and chronic bloating.
Utilizing this tracker facilitates a data-driven approach to gut health, helping to manage irritable bowel syndrome (IBS) symptoms and improve overall metabolic function. Documenting fermentation triggers ensures better nutrient absorption and long-term digestive wellness through precise dietary adjustments.
Hormone Lab Results Comparison Sheet
💾 Hormone Lab Results Comparison Sheet .xls
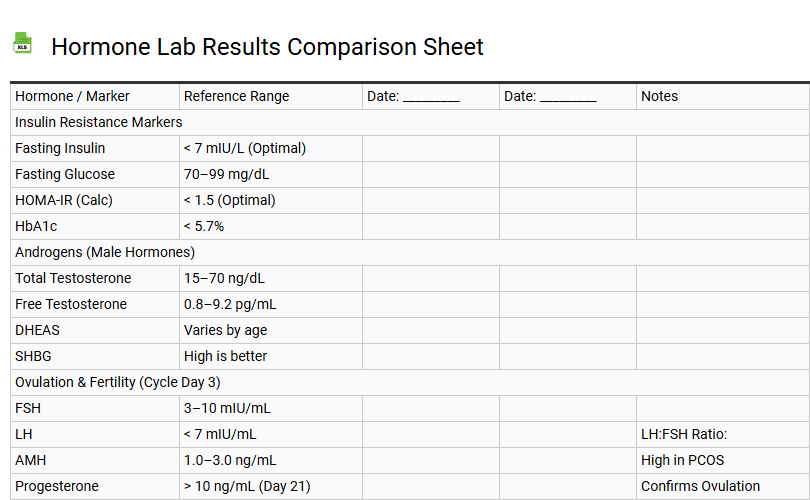
A hormone lab results comparison sheet is an essential tool for longitudinal endocrine monitoring and metabolic health tracking. This structured template allows patients and clinicians to visualize biomarker fluctuations by documenting blood work analysis side-by-side over multiple testing intervals.
Effective comparison logs should incorporate several critical clinical markers:
- Baseline levels versus subsequent follow-up data.
- Laboratory-specific reference ranges for accurate data interpretation.
- Key profiles including thyroid markers (TSH, T4), estradiol, testosterone, and cortisol.
- Correlation between hormonal imbalances and reported physiological symptoms.
By utilizing this comparative format, individuals can identify subtle physiological trends that isolated reports might miss. This data-driven approach optimizes hormone replacement therapy (HRT) adjustments and supports informed decision-making regarding wellness interventions and overall hormonal optimization.
Cravings and Satiety Scale Log
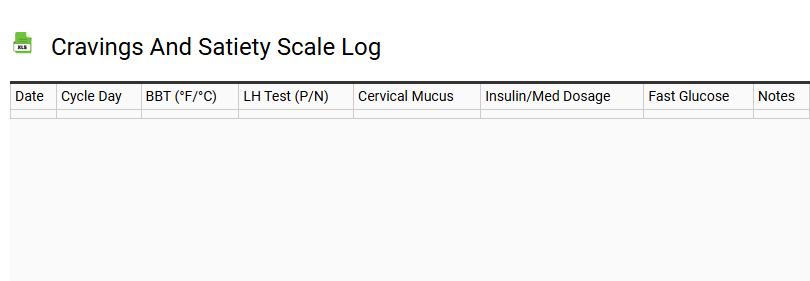
💾 Cravings and Satiety Scale Log .xls
A Cravings and Satiety Scale Log serves as a vital instrument for mastering appetite regulation and understanding physiological hunger cues. By documenting dietary habits within this structured framework, individuals can bridge the gap between emotional triggers and genuine metabolic needs. This nutritional tracking tool utilizes a numerical spectrum to quantify fullness levels, helping users identify patterns in caloric intake and glycemic response.
Implementing such a food journal fosters mindful eating practices, allowing for improved portion control and stabilized energy levels throughout the day. Monitoring these internal signals is essential for sustainable weight management and optimizing overall metabolic health. Through consistent data entry, you gain deeper insights into how specific macronutrients impact your satiety index, ultimately empowering more informed nutritional choices and healthier long-term lifestyle behaviors.
Inositol Dosage and Response Tracker
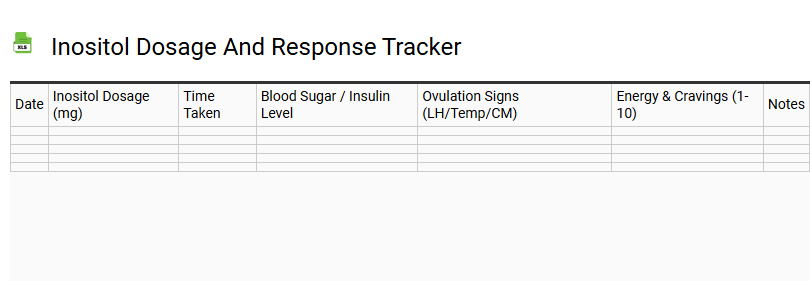
💾 Inositol Dosage and Response Tracker .xls
Optimize your PCOS management and hormonal balance with this precision-engineered Inositol Dosage and Response Tracker. This template facilitates the systematic monitoring of Myo-inositol and D-chiro-inositol intake to enhance insulin sensitivity and metabolic health. By documenting daily therapeutic dosages, users can correlate supplement protocols with improvements in ovarian function, menstrual regularity, and glycemic control. This data-driven approach is essential for tracking reproductive health markers, mood regulation, and androgen levels. Whether you are targeting fertility support or weight management, logging your endocrine response helps identify the ideal nutrient ratio for your unique biochemistry. Use this tool to visualize symptom relief trends, ensuring your holistic wellness strategy effectively promotes follicular health and long-term hormonal stability through consistent nutritional intervention and metabolic support.
Water Intake and Electrolyte Log
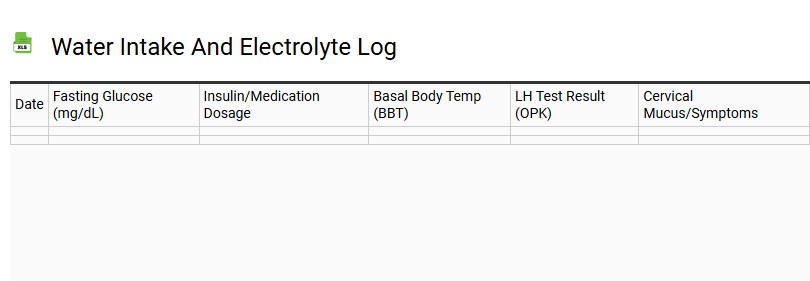
💾 Water Intake and Electrolyte Log .xls
This comprehensive template streamlines hydration tracking and the monitoring of fluid consumption patterns. By utilizing this log, individuals can maintain a precise record of daily water intake and electrolyte replenishment to ensure an optimal mineral balance. Tracking essential solutes like sodium, potassium, and magnesium is vital for supporting cellular function and preventing dehydration. This wellness tracker captures biometric data related to total liquid intake, allowing users to align their habits with metabolic health goals. Whether logging sports drinks, infused water, or plain H2O, this structured format helps identify deficiencies in systemic hydration. Consistent use of a hydration log fosters better awareness of physiological balance and nutritional recovery, making it an indispensable tool for athletes and health-conscious individuals aiming for peak physical performance and long-term vitality.
Basal Metabolic Rate BMR Calculator
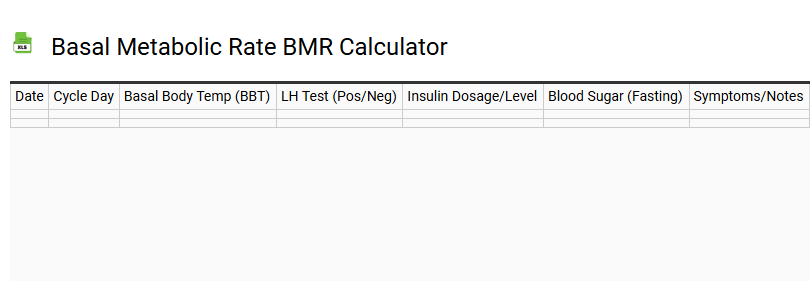
💾 Basal Metabolic Rate BMR Calculator .xls
Your Basal Metabolic Rate (BMR) represents the minimum number of calories your body requires to perform basic life-sustaining functions while at rest. This essential metric accounts for vital biological processes like breathing, circulation, and cell production. By utilizing validated formulas such as the Mifflin-St Jeor or Harris-Benedict equation, this calculator evaluates your age, gender, height, and body weight to determine your unique resting energy expenditure (REE).
Understanding your BMR is the core foundation for effective weight management and personalized nutrition plans. Whether your fitness goal is fat loss or muscle gain, knowing your baseline metabolism helps you calculate your Total Daily Energy Expenditure (TDEE). By adjusting for physical activity levels-ranging from sedentary to highly active-you can accurately define your daily caloric needs for optimal metabolic health and sustainable body composition results.
Managing Polycystic Ovary Syndrome requires precise tracking of metabolic and reproductive indicators. This template offers a comprehensive system for monitoring insulin resistance alongside ovulation patterns. By documenting daily blood sugar levels, basal body temperature, and LH surges, users identify critical links between glucose stability and hormonal balance.
Utilizing this log empowers individuals to visualize menstrual cycle trends and optimize fertility. Consistent data entry remains a powerful tool for reclaiming endocrine health and achieving sustainable wellness goals through actionable insights.