
Postprandial Glucose Response Chart Template
Managing metabolic health begins with understanding how specific foods influence your blood sugar. A postprandial glucose response chart serves as an essential tool for tracking glycemic variability after meals. By consistently logging data, individuals can identify insulin sensitivity patterns and pinpoint triggers for hyperglycemia. This systematic approach to glucose monitoring aids in optimizing dietary choices and stabilizing energy. Utilizing a structured template simplifies the analysis of post-meal spikes and long-term health trends. Please check the already made variation of templates below.
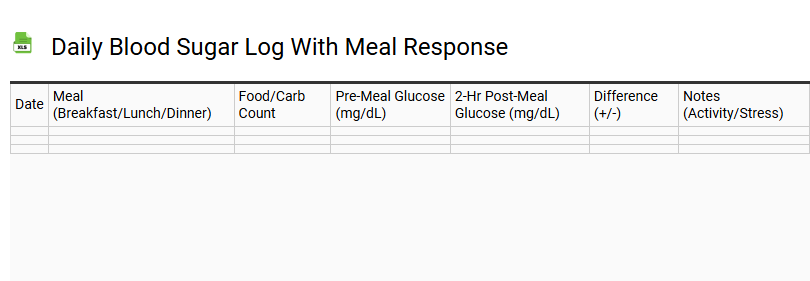
Daily Blood Sugar Log with Meal Response
💾 Daily Blood Sugar Log with Meal Response .xls
Maintaining a comprehensive daily blood sugar log is essential for effective diabetes management and optimizing metabolic health. By tracking glucose levels alongside meal response, individuals can identify how specific carbohydrate intake influences postprandial spikes. This template facilitates the precise monitoring of fasting blood sugar, pre-meal readings, and two-hour post-meal data to evaluate insulin sensitivity.
Documenting food triggers and meal timing helps visualize glycemic variability, allowing for informed adjustments in diet or medication. Consistent blood glucose monitoring through a dedicated health journal reduces the risk of hyperglycemia and hypoglycemia. By capturing these glycemic trends, patients can provide healthcare providers with a detailed glucose profile to improve long-term clinical outcomes and overall wellness.
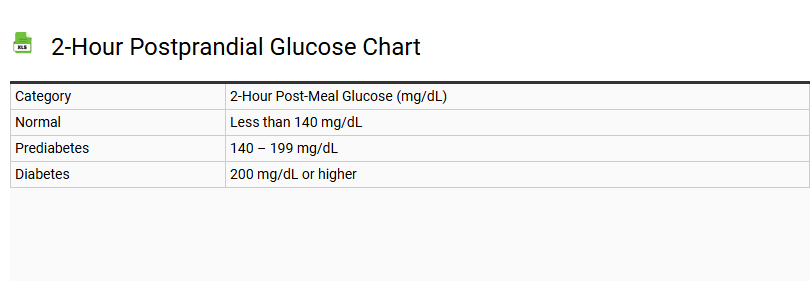
2-Hour Postprandial Glucose Chart
💾 2-Hour Postprandial Glucose Chart .xls
A 2-hour postprandial glucose chart serves as a critical diagnostic tool for monitoring blood sugar levels after food consumption. This tracking template records the body's insulin sensitivity and glycemic response precisely 120 minutes following the start of a meal. By documenting these values, individuals managing type 2 diabetes or prediabetes can identify harmful glucose spikes and evaluate metabolic health.
- Enhances glycemic control through data-driven insights.
- Informs meal planning and dietary adjustments.
- Assists healthcare providers in fine-tuning diabetes medication dosages.
- Tracks progress toward achieving optimal A1C target goals.
Maintaining a consistent blood glucose log helps stabilize peak glucose concentrations, ensuring readings remain within the recommended target range. This proactive monitoring is essential for preventing long-term microvascular complications and optimizing overall energy levels throughout the day.
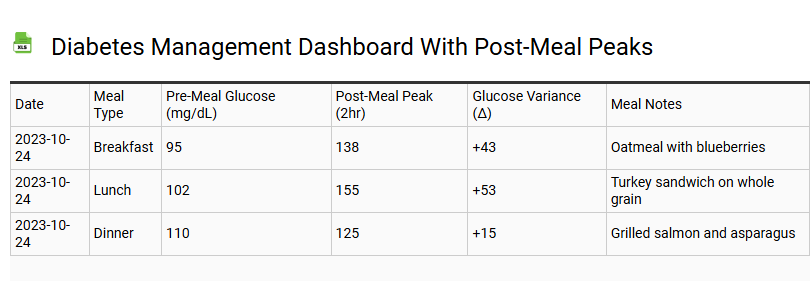
Diabetes Management Dashboard with Post-Meal Peaks
💾 Diabetes Management Dashboard with Post-Meal Peaks .xls
This diabetes management dashboard template facilitates precise glycemic control by monitoring post-meal peaks and postprandial hyperglycemia. Designed for seamless integration with continuous glucose monitoring (CGM) systems, the interface tracks blood glucose levels in real-time to identify glucose spikes occurring after food intake. Users can visualize the direct correlation between carbohydrate counting, insulin dosage, and metabolic health via interactive charts. By highlighting glucose variability and time-in-range metrics, the tool assists in stabilizing HbA1c estimates and improving insulin sensitivity. The layout emphasizes critical health metrics essential for type 1 and type 2 diabetes care, offering actionable insights into glucose stability and dietary impact. This streamlined approach empowers patients to refine meal planning and minimize long-term complications through better glycemic variability management.
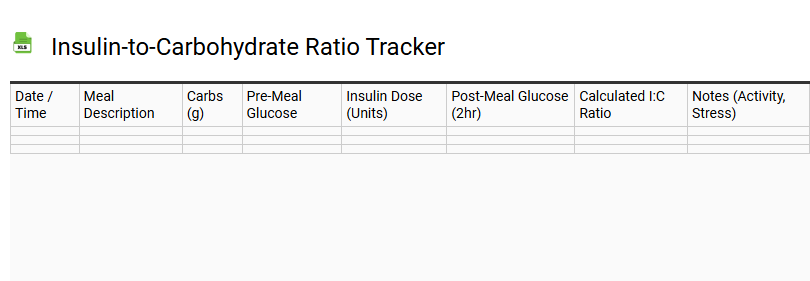
Insulin-to-Carbohydrate Ratio Tracker
💾 Insulin-to-Carbohydrate Ratio Tracker .xls
Efficient diabetes management requires precise calculation of your insulin-to-carbohydrate ratio (ICR). This tracking template serves as a comprehensive log for monitoring blood glucose levels, carbohydrate intake, and bolus insulin dosages. By documenting pre-meal glucose and postprandial results, users can identify patterns in insulin sensitivity and refine their carb counting accuracy. Utilizing a structured ICR log assists in achieving optimal glycemic control, effectively reducing the risk of hyperglycemia and hypoglycemia. This data-driven approach empowers patients to make informed meal planning adjustments and fine-tune their insulin therapy. Consistent use of this digital tracker simplifies complex bolus dosing math, ensuring that every insulin unit administered aligns perfectly with metabolic needs for improved long-term health outcomes.
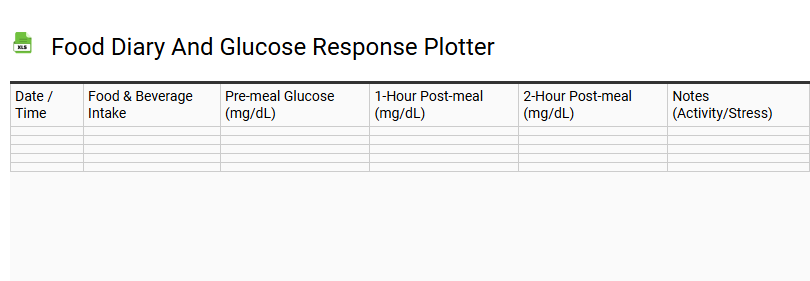
Food Diary and Glucose Response Plotter
💾 Food Diary and Glucose Response Plotter .xls
This integrated nutrition tracking system combines a meticulous food diary with a dynamic glucose response plotter to provide deep insights into your metabolic health. By documenting caloric intake, macronutrient ratios, and specific dietary triggers, users can visualize the direct correlation between meal timing and blood sugar fluctuations.
The tool captures postprandial glucose levels, allowing for the precise monitoring of glycemic variability and insulin sensitivity. Utilizing data visualization to map biometric trends, this template helps identify high-glycemic foods that cause energy crashes or hyperglycemic spikes. Whether managing diabetes or optimizing athletic performance, tracking the relationship between nutritional habits and physiological responses is essential. Empower your health journey through longitudinal analysis of glycemic curves, ensuring more informed dietary adjustments and stabilized energy levels throughout the day.
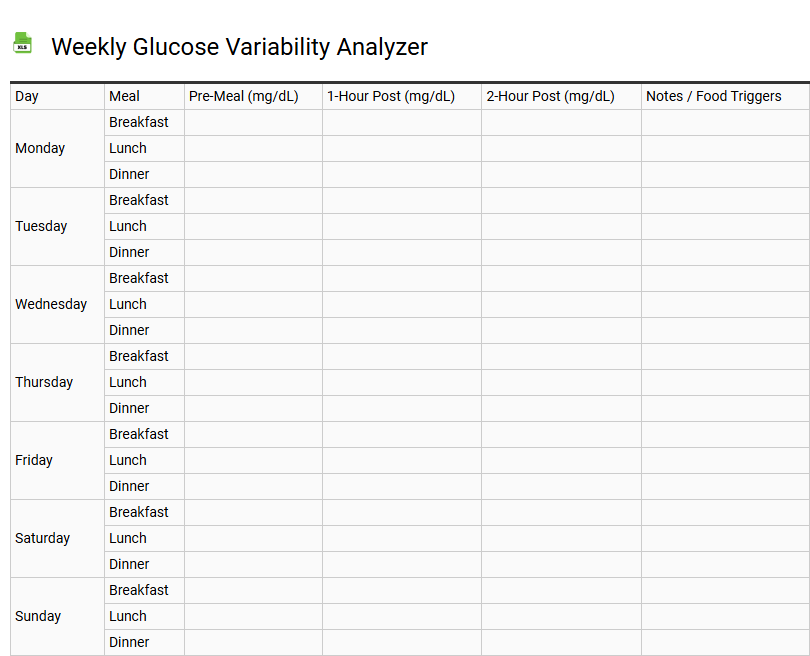
Weekly Glucose Variability Analyzer
💾 Weekly Glucose Variability Analyzer .xls
The Weekly Glucose Variability Analyzer serves as a sophisticated digital tool designed to measure glycemic control and track significant blood sugar fluctuations. By processing CGM data or manual logs, this template calculates the coefficient of variation (CV) and standard deviation to assess metabolic stability. Identifying postprandial spikes and hypoglycemia risks becomes seamless through structured weekly trend analysis. This analyzer prioritizes time-in-range (TIR) metrics, offering a comprehensive overview of mean glucose levels over a seven-day period. Utilizing these biometric insights allows for precise adjustments in lifestyle or insulin sensitivity management. Enhancing your diabetes management strategy with data-driven reports ensures a proactive approach to metabolic health, reducing the physiological stress caused by erratic glucose excursions and improving long-term clinical outcomes.
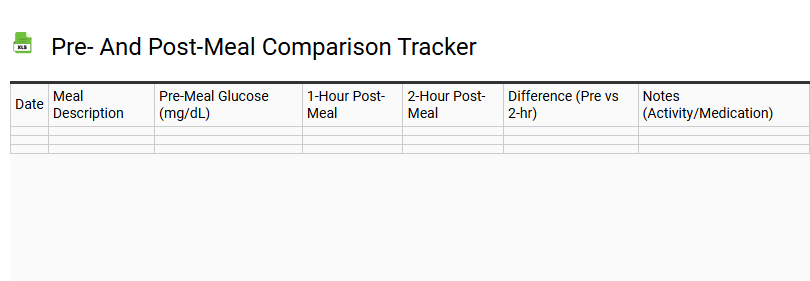
Pre- and Post-Meal Comparison Tracker
💾 Pre- and Post-Meal Comparison Tracker .xls
A pre- and post-meal comparison tracker serves as a vital tool for monitoring how specific food choices influence metabolic health and overall well-being. By documenting blood glucose levels, digestive comfort, and satiety before and after nutritional intake, users gain precise insights into their unique glycemic response and insulin sensitivity.
This systematic food diary approach helps identify triggers for postprandial energy crashes or gastrointestinal distress. Consistent wellness logging facilitates data-driven adjustments to dietary habits, optimizing macronutrient ratios for sustained energy levels. Tracking these physiological reactions ensures better management of weight and metabolic stability. Using this template streamlines the process of correlating physical symptoms with specific ingredients, fostering a mindful approach to eating while supporting long-term health objectives through accurate biometric data collection and analysis.
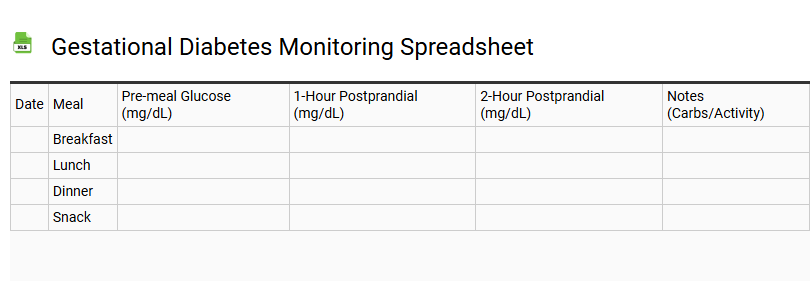
Gestational Diabetes Monitoring Spreadsheet
💾 Gestational Diabetes Monitoring Spreadsheet .xls
Managing gestational diabetes requires precise tracking of blood glucose levels to ensure optimal maternal and fetal health. A dedicated monitoring spreadsheet serves as a comprehensive glucose log, allowing expectant mothers to record fasting sugar and postprandial readings with ease. By documenting daily carbohydrate intake, physical activity, and insulin dosages, users can effectively visualize their glycemic control.
This digital template streamlines communication during prenatal checkups, providing healthcare providers with actionable data to refine treatment plans. Utilizing a structured blood sugar tracker helps maintain readings within the recommended target range, supporting overall pregnancy wellness. Essential features often include:
- Automated daily averages for trend analysis.
- Categorized slots for breakfast, lunch, and dinner logs.
- Notes for tracking symptoms and meal triggers.
Maintaining a consistent diabetes diary is a vital component of proactive medical management for a healthy delivery.
Glycemic Index Response Chart
💾 Glycemic Index Response Chart .xls
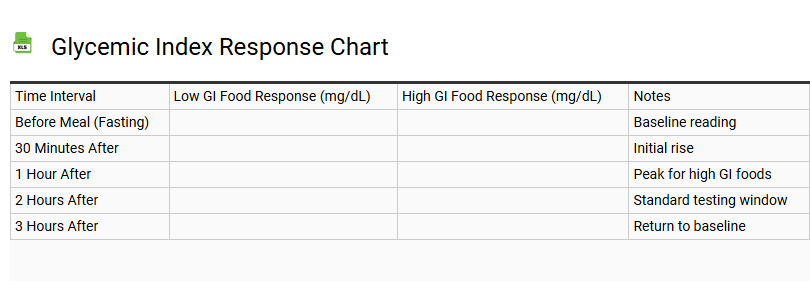
A Glycemic Index Response Chart serves as a vital diagnostic template for monitoring postprandial blood glucose fluctuations. This analytical tool visualizes the metabolic impact of various carbohydrates on serum insulin levels. By plotting the glucose curve, users can differentiate between high-GI foods that trigger rapid blood sugar spikes and low-glycemic alternatives that promote sustained energy release.
Integrating this chart into dietary management protocols aids in optimizing insulin sensitivity and controlling glycemic load. It provides a comprehensive overview of carbohydrate metabolism, helping individuals identify hyperglycemic trends and manage diabetic conditions through precise nutritional tracking. Utilizing this data-driven framework ensures better macronutrient selection, fostering long-term metabolic health and stabilizing plasma glucose concentrations after meal consumption.
Continuous Glucose Monitor Data Template
💾 Continuous Glucose Monitor Data Template .xls
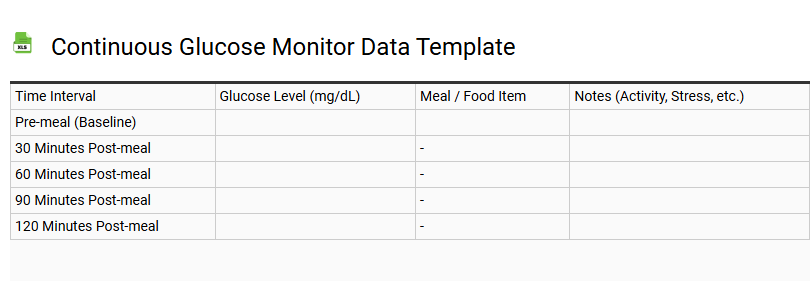
A Continuous Glucose Monitor (CGM) data template serves as a sophisticated framework for tracking blood sugar fluctuations and metabolic trends. By organizing real-time sensor readings from interstitial fluid, this log helps users visualize glycemic variability and identify critical patterns within their glucose profile. The template focuses on essential metrics such as Time in Range (TIR), mean glucose levels, and daily excursions into hyperglycemia or hypoglycemia.
Utilizing a standardized format allows for precise correlation between carbohydrate intake, physical activity, and insulin sensitivity. Effective data logging highlights:
- Post-prandial spikes and recovery duration.
- Overnight basal stability and fasting trends.
- Impact of lifestyle factors on blood glucose management.
Optimizing this digital log facilitates better clinical decision-making, providing actionable insights for diabetes management and long-term metabolic health through detailed glucose curve analysis and trend reports.
Post-Meal Glucose Spike Log
💾 Post-Meal Glucose Spike Log .xls
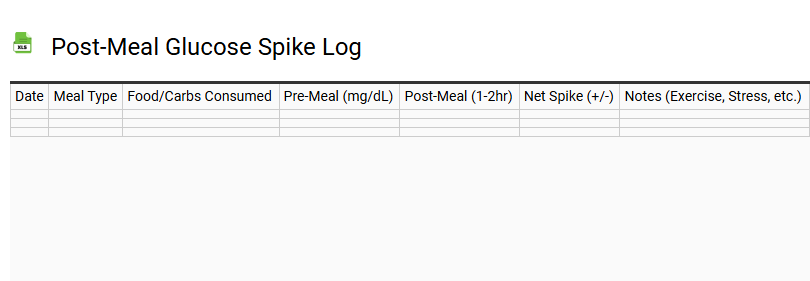
A post-meal glucose spike log is a vital instrument for precise diabetes management and metabolic optimization. By systematically tracking post-prandial blood sugar levels, individuals can analyze their unique glycemic response to specific carbohydrate intake and fiber ratios. This structured documentation captures glucose excursions, typically measured one to two hours after eating, to identify patterns of hyperglycemia or insulin resistance.
Integrating CGM data or finger-stick readings into a comprehensive food diary allows for the correlation of pre-prandial baselines with peak elevations. Essential metrics for a robust log include:
- Meal composition and macronutrient distribution
- Timing of glucose monitoring sessions
- Physical activity levels impacting insulin sensitivity
- Observations of reactive hypoglycemia
Monitoring these variables helps stabilize glycemic variability, enabling data-driven adjustments to diet and medication that ultimately improve long-term HbA1c results and overall metabolic flexibility.
Comprehensive Diabetes Wellness Tracker
💾 Comprehensive Diabetes Wellness Tracker .xls
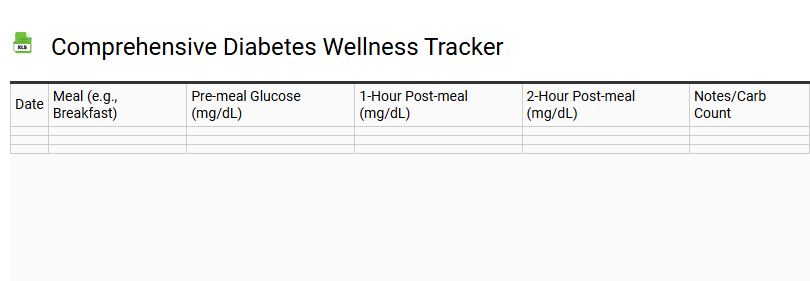
Managing endocrine health requires a systematic approach to blood glucose monitoring and medication adherence. This comprehensive diabetes wellness tracker serves as a vital digital logbook for recording daily glycemic fluctuations, insulin dosages, and carbohydrate intake. By utilizing this structured template, users can accurately analyze patterns in their postprandial glucose levels and correlate data with physical activity and nutritional choices. Centralizing biometric data-including HbA1C results, body mass index, and lipid profiles-empowers individuals to achieve optimal glycemic control. This preventative care tool facilitates informed discussions with healthcare providers, ensuring precise adjustments to diabetic treatment plans. Tracking hyperglycemia and hypoglycemia episodes alongside lifestyle factors promotes long-term metabolic stability and reduces the risk of chronic complications through organized, actionable health insights.
This template for a postprandial glucose response chart serves as a vital instrument for monitoring blood sugar fluctuations following meals. By documenting precise readings, users gain insights into their insulin sensitivity and glycemic variability. Maintaining a structured log simplifies diabetes management and supports long-term metabolic health. Utilizing this clinical reference helps bridge the gap between dietary habits and physiological impact, providing the actionable data necessary for informed healthcare consultations and achieving sustained, healthy glycemic control.