
Printable Hypotension Monitoring Log Template for Blood Pressure Tracking
Effectively managing low blood pressure requires consistent observation of daily readings and associated symptoms. A printable hypotension monitoring log serves as an essential tool for documenting vital signs, such as systolic and diastolic levels, alongside occurrences of dizziness or fatigue. This structured tracking chart enhances cardiovascular health management by highlighting patterns in orthostatic hypotension. Using a dedicated blood pressure log facilitates clearer communication with healthcare professionals regarding your physiological trends. Please check our already made variation of templates below.
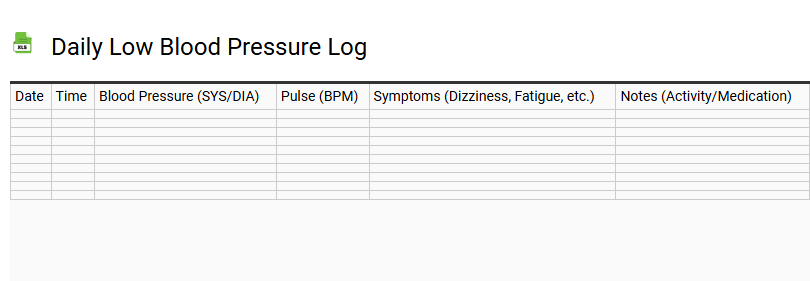
Daily Low Blood Pressure Log
💾 Daily Low Blood Pressure Log .xls
Utilizing a daily low blood pressure log is a vital strategy for managing hypotension and monitoring cardiovascular health. By consistently recording systolic and diastolic readings measured in mmHg, users can identify blood pressure fluctuations linked to symptoms like dizziness, faintness, or chronic fatigue. This tracking template facilitates precise data collection, capturing heart rate, time-stamps, and potential triggers such as orthostatic hypotension or dehydration.
Maintaining an organized health journal assists medical professionals in analyzing long-term trends and evaluating medication side effects. Documenting lifestyle factors, including fluid intake and sodium consumption, provides a comprehensive diagnostic overview. This self-monitoring tool ensures that hypotensive episodes are accurately reported, empowering patients to manage low arterial tension effectively through informed clinical consultations.
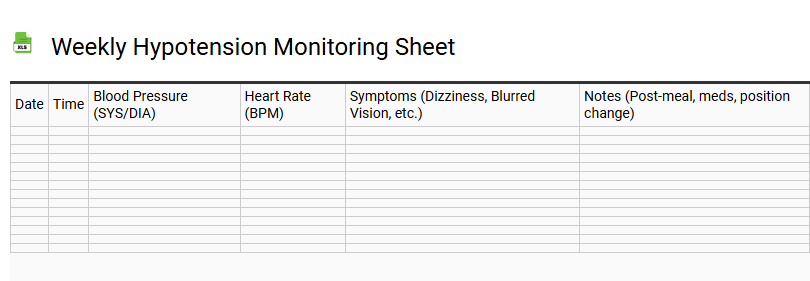
Weekly Hypotension Monitoring Sheet
💾 Weekly Hypotension Monitoring Sheet .xls
A weekly hypotension monitoring sheet serves as a vital diagnostic tool for tracking persistent low blood pressure trends. This structured blood pressure log enables patients to record systolic and diastolic readings, capturing essential data for clinical review. By documenting daily measurements, individuals can identify triggers for orthostatic hypotension, such as postural changes, dehydration, or medication side effects.
Using a sphygmomanometer or digital monitor, users track fluctuations alongside symptoms like dizziness, fatigue, or syncope. This cardiovascular health template facilitates the identification of patterns related to autonomic dysfunction or nutritional deficiencies. Consistent arterial pressure monitoring provides healthcare providers with the necessary insights to adjust management plans and improve patient safety. Maintaining an accurate health journal ensures that transient drops in pressure are documented, supporting proactive wellness and effective long-term hypotension management.
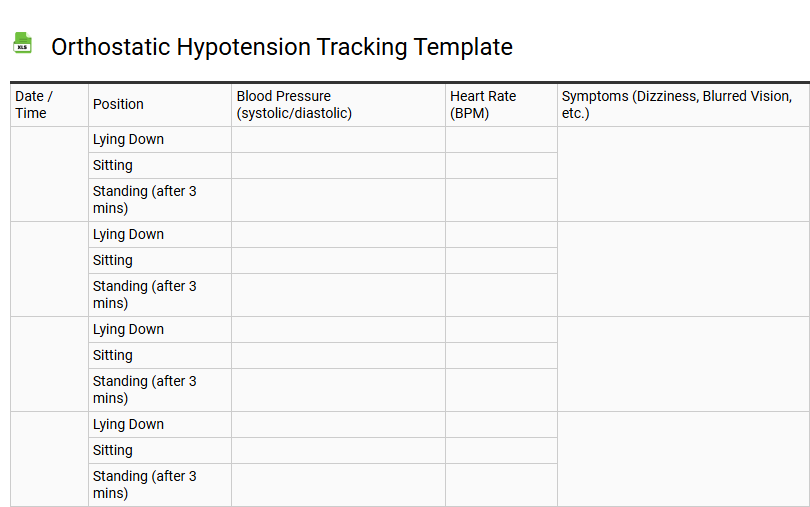
Orthostatic Hypotension Tracking Template
💾 Orthostatic Hypotension Tracking Template .xls
Efficiently monitor postural hypotension using this Orthostatic Hypotension Tracking Template. This specialized clinical tool facilitates precise blood pressure monitoring across sequential physical positions, including supine, seated, and standing states. By documenting systolic and diastolic fluctuations, users can identify significant orthostatic drops indicative of autonomic dysfunction or baroreflex sensitivity issues.
Track associated symptoms such as dizziness, lightheadedness, and syncope alongside heart rate variations to provide healthcare providers with actionable data. Maintaining consistent BP logs is vital for evaluating cardiovascular health, assessing medication side effects, and monitoring hydration levels. This structured approach streamlines the assessment of orthostatic vitals, ensuring accurate management of blood pressure variability and enhancing patient safety during postural transitions.
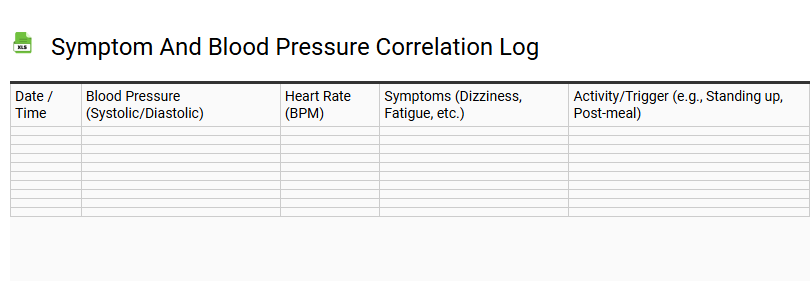
Symptom and Blood Pressure Correlation Log
💾 Symptom and Blood Pressure Correlation Log .xls
A Symptom and Blood Pressure Correlation Log serves as a vital diagnostic instrument for managing cardiovascular health and identifying hypertension patterns. By systematically recording systolic and diastolic readings alongside specific physical sensations, users can uncover critical links between physiological triggers and heart rate fluctuations.
This medical diary facilitates a detailed trend analysis, enabling healthcare providers to assess medication efficacy and adjust treatment protocols with precision. Whether tracking dizziness, headaches, or palpitations, this vitals log transforms raw data into actionable insights for chronic condition management.
Utilizing a structured tracking tool promotes proactive health monitoring, ensuring that subtle shifts in blood pressure are contextualized against environmental or dietary factors. Ultimately, this comprehensive health log bridges the gap between daily symptoms and clinical data, fostering informed dialogue during medical consultations and enhancing long-term wellness.
Morning and Evening BP Tracker for Hypotension
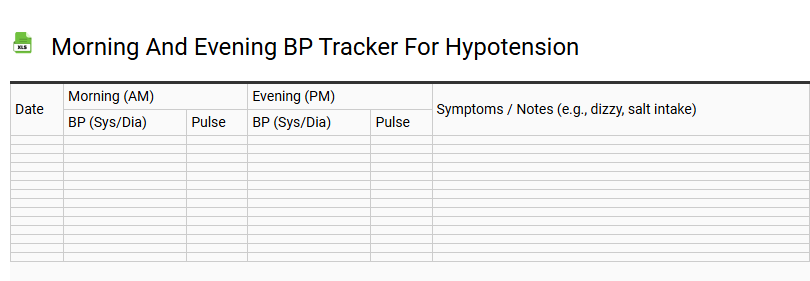
💾 Morning and Evening BP Tracker for Hypotension .xls
Maintaining a dedicated log for low blood pressure is essential for identifying daily trends and potential triggers. This record focuses on capturing systolic and diastolic measurements during two critical windows. The morning entry should be taken shortly after waking but before consuming caffeine or medication. The evening measurement provides insight into how the body regulates itself after a full day of activity and meals.
Accurate monitoring requires sitting quietly for five minutes before each reading. Beyond the numbers, it is beneficial to note any physical sensations experienced during the day, such as:
- Dizziness or lightheadedness upon standing
- Persistent fatigue or unexpected weakness
- Blurred vision or lack of concentration
- Nausea or cold, clammy skin
Sharing this structured data with a healthcare provider ensures a comprehensive understanding of your circulatory health and helps tailor management strategies to your specific needs.
Monthly Hypotension Trend Chart
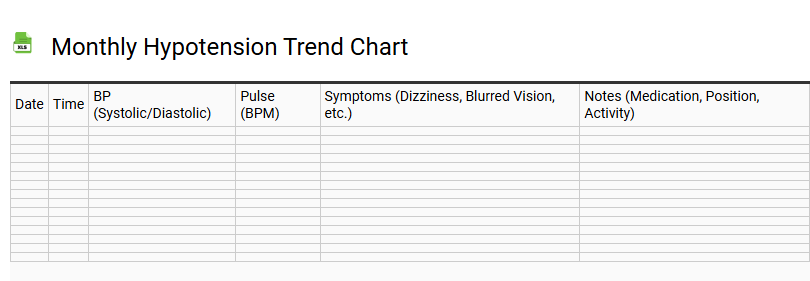
💾 Monthly Hypotension Trend Chart .xls
A Monthly Hypotension Trend Chart serves as a specialized clinical tool for tracking low blood pressure patterns over time. This systematic log captures daily systolic and diastolic readings, allowing healthcare providers to visualize physiological fluctuations and identify potential triggers for chronic hypotension. By documenting vital signs consistently, patients can monitor symptoms associated with orthostatic hypotension or medication side effects.
This data-driven template facilitates proactive cardiovascular health management by highlighting significant trends within a thirty-day period. Utilizing such a structured medical record assists in diagnosing underlying conditions and optimizing treatment plans. Accurate data entry regarding blood pressure measurements is essential for evaluating circulatory health and preventing adverse events. Integrating this monitoring log into routine care empowers individuals to provide precise clinical data during consultations, ultimately improving long-term health outcomes and therapeutic precision.
Medication Impact Blood Pressure Log
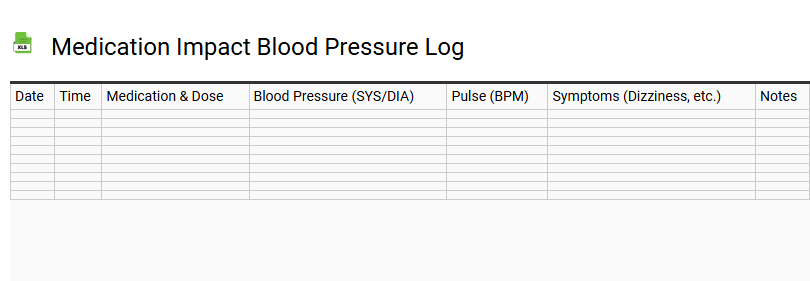
💾 Medication Impact Blood Pressure Log .xls
A Medication Impact Blood Pressure Log is an essential instrument for proactive hypertension management. This structured health journal enables patients to meticulously record systolic and diastolic readings, ensuring a clear overview of cardiovascular health over time. By documenting dosage timings alongside heart rate and pulse data, individuals can identify direct correlations between antihypertensive drugs and physiological responses. Tracking these circulatory trends helps isolate potential side effects and evaluate pharmaceutical efficacy for physician consultations. Using a standardized template facilitates accurate data logging, providing clinicians with the medical insights necessary to optimize treatment plans. Regular daily monitoring through a dedicated log empowers users to manage blood pressure fluctuations, ultimately enhancing long-term wellness tracking and reducing risks associated with chronic vascular conditions.
Hydration and Blood Pressure Sync Tracker
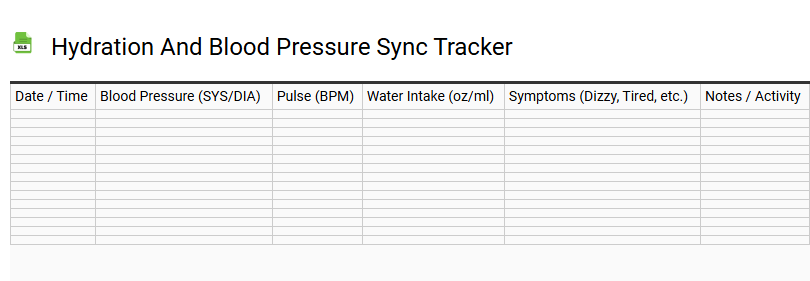
💾 Hydration and Blood Pressure Sync Tracker .xls
This tracking interface centralizes daily fluid intake and cardiovascular readings into a unified digital log. By documenting water consumption alongside systolic and diastolic measurements, users can observe how hydration levels influence heart health over time.
- Fluid Monitoring: Record volume in ounces or milliliters with precise time-stamping to ensure consistent daily targets are met.
- Vitals Logging: Enter blood pressure results and pulse metrics to visualize physiological responses to fluid balance.
- Integrated Analytics: Identify correlations between peak hydration and stabilized pressure readings through organized data sets.
Utilizing this structured approach promotes better awareness of internal homeostasis. Maintaining optimal fluid levels supports blood volume regulation, assisting in the management of healthy cardiovascular ranges. This template serves as a comprehensive resource for those seeking to understand the direct relationship between their hydration habits and heart performance.
Post-Exercise Hypotension Monitoring Sheet
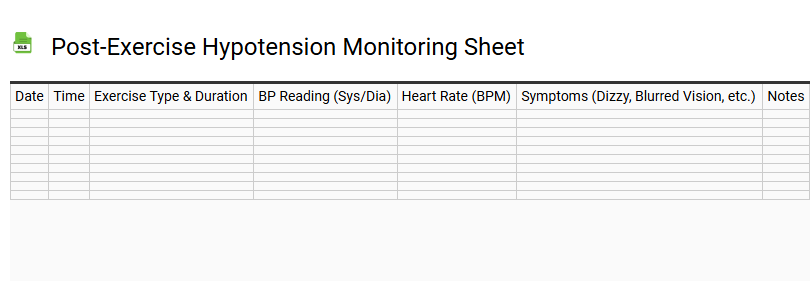
💾 Post-Exercise Hypotension Monitoring Sheet .xls
A Post-Exercise Hypotension (PEH) Monitoring Sheet is an essential clinical tool designed to track the temporary reduction in blood pressure following acute physical activity. This structured template facilitates the systematic logging of systolic and diastolic readings during the critical recovery phase. By documenting baseline measurements alongside post-workout data, individuals can evaluate the antihypertensive effects of aerobic or resistance training.
Utilizing this log helps analyze changes in vascular resistance and cardiac output, providing insights into hemodynamic responses and cardiovascular health. Consistent monitoring aids in identifying significant arterial pressure drops, which are pivotal for effective hypertension management. This data-driven approach ensures precise observation of orthostatic stability and long-term physiological adaptations, assisting healthcare providers in tailoring exercise interventions for optimal wellness and recovery tracking.
Postprandial Hypotension Assessment Log
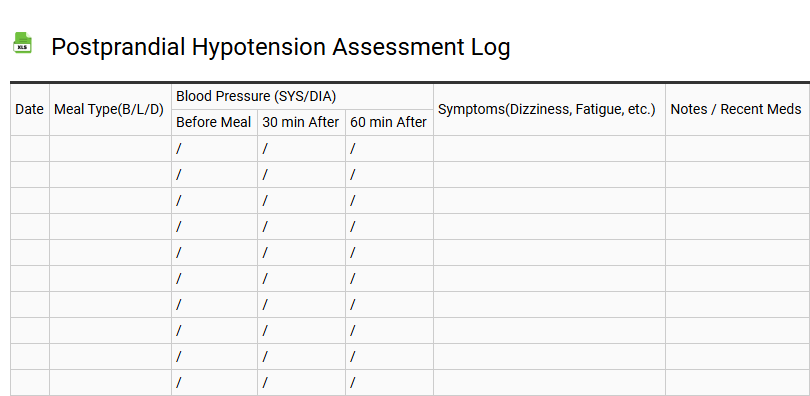
💾 Postprandial Hypotension Assessment Log .xls
A Postprandial Hypotension Assessment Log serves as a critical diagnostic tool for tracking significant systolic blood pressure drops occurring after meal consumption. This systematic blood pressure log monitors cardiovascular health by recording baseline pre-meal vitals alongside serial post-ingestion measurements. By documenting orthostatic symptoms such as dizziness, syncope, or blurred vision, patients can identify patterns of autonomic dysfunction.
Utilizing this template facilitates the management of geriatric health and autonomic failure, providing healthcare providers with actionable data regarding meal composition and splanchnic blood flow impacts. Tracking these fluctuations is essential for identifying post-meal hypotension, allowing for targeted lifestyle interventions like adjusted hydration or smaller meal portions. Consistent data entry ensures precise monitoring of circulatory system responses, enhancing safety for those prone to sudden hypotensive episodes during the postprandial period.
Pregnancy Blood Pressure Monitoring Template
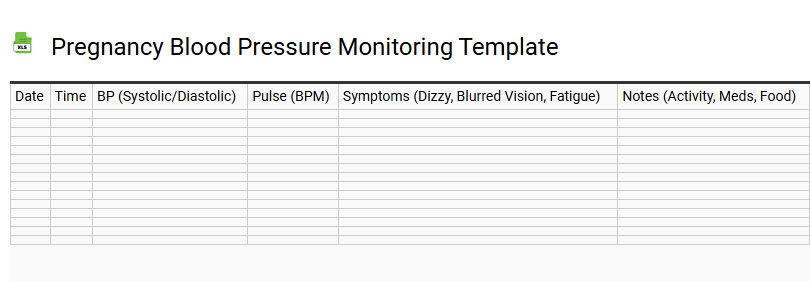
💾 Pregnancy Blood Pressure Monitoring Template .xls
A comprehensive pregnancy blood pressure monitoring template serves as a vital clinical tool for tracking maternal hemodynamics and identifying early indicators of gestational hypertension or preeclampsia. By systematically recording daily systolic and diastolic readings, expectant mothers can maintain a precise BP log essential for high-risk prenatal care and cardiovascular stability.
This tracking framework focuses on several key health metrics:
- Monitoring pregnancy-induced hypertension (PIH) trends across all trimesters.
- Establishing a baseline blood pressure to detect sudden physiological spikes.
- Documenting pulse rates and associated symptoms like edema or protein in urine.
- Enhancing maternal-fetal health outcomes through consistent data collection.
Utilizing a structured hypertension management sheet empowers patients to provide healthcare providers with actionable data, facilitating timely medical interventions and ensuring fetal wellbeing throughout the gestational period.
Elderly Daily Vital Signs and Hypotension Tracker
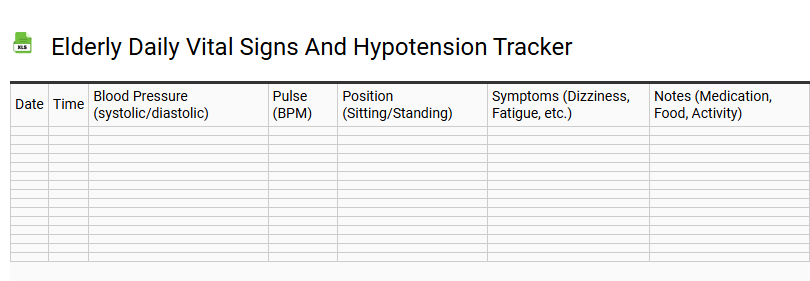
💾 Elderly Daily Vital Signs and Hypotension Tracker .xls
This Elderly Daily Vital Signs and Hypotension Tracker serves as a vital medical log for proactive senior health management. By consistently recording systolic and diastolic blood pressure, heart rate, and oxygen saturation, caregivers can effectively monitor cardiovascular health and identify patterns of orthostatic hypotension. Monitoring physiological data across various positions-sitting, standing, and supine-is crucial for fall prevention and managing blood pressure fluctuations.
Utilizing this daily health tracking template ensures precise caregiver records, facilitating informed medication adjustments during clinical consultations. High-quality hypertension management relies on accurate longitudinal data to mitigate risks associated with hypotensive episodes. Integrating wellness monitoring into daily routines empowers families to maintain a stable health baseline, enhancing the safety and longevity of seniors through diligent vital sign surveillance and circulatory health assessment.
Heart Rate and Hypotension Sync Log
💾 Heart Rate and Hypotension Sync Log .xls
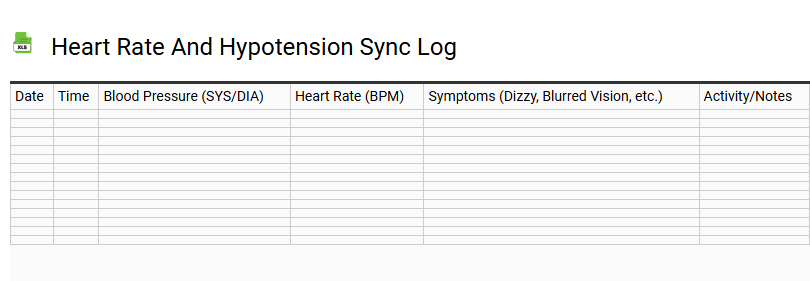
This Heart Rate and Hypotension Sync Log serves as a comprehensive tool for monitoring cardiovascular stability and physiological responses. By documenting pulse rate in direct correlation with blood pressure fluctuations, users can effectively track patterns of orthostatic hypotension or autonomic dysfunction. This template facilitates the precise recording of systolic and diastolic metrics alongside heart rate variability, providing clinical insights into symptoms like dizziness, syncope, or fatigue.
Consistent vital signs monitoring is essential for identifying bradycardia, tachycardia, or chronic low blood pressure trends. Utilizing this synchronized log ensures that physiological data is timestamped and contextualized, aiding healthcare providers in diagnostic accuracy. Proper documentation of these health metrics supports better management of cardiovascular health and empowers patients to visualize the relationship between their pulse and arterial pressure throughout daily activities.
Emergency Hypotension Protocol Log
💾 Emergency Hypotension Protocol Log .xls
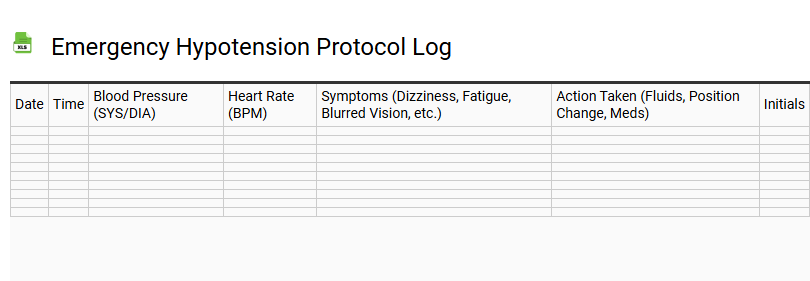
This Emergency Hypotension Protocol Log serves as a vital clinical tool for tracking rapid interventions during acute hemodynamic instability. Designed for critical care environments, the template captures real-time data regarding mean arterial pressure (MAP), intravenous fluid resuscitation, and the titration of vasopressors like norepinephrine.
By documenting precise timestamps for systolic and diastolic blood pressure fluctuations, medical staff can effectively monitor patient response to fluid boluses and pharmacological support. This structured documentation focuses on reversing hypovolemia and managing various forms of shock to ensure adequate tissue perfusion. Utilizing this log streamlines communication between nursing teams and rapid response units, providing a chronological audit trail of vital signs, mental status changes, and urine output. It is an essential component for maintaining patient safety and standardized care delivery during life-threatening cardiovascular events and sudden hypotensive episodes.
Sodium Intake and Blood Pressure Tracker
💾 Sodium Intake and Blood Pressure Tracker .xls
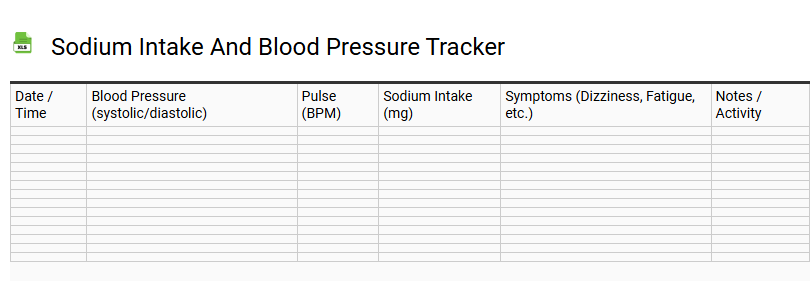
Effective management of hypertension necessitates a meticulous approach to monitoring both dietary habits and physiological responses. Utilizing a sodium intake and blood pressure tracker serves as a critical tool for maintaining cardiovascular wellness. By documenting daily salt consumption in milligrams alongside systolic and diastolic readings, users can identify direct correlations between high sodium levels and fluid retention.
This systematic nutritional logging supports adherence to the DASH diet and promotes a balanced electrolyte profile. Consistent tracking helps individuals stay within recommended daily limits to protect renal health and reduce cardiac strain. Integrating blood pressure monitoring with a detailed food diary empowers proactive dietary management. This holistic overview is essential for anyone committed to a low-sodium lifestyle and long-term heart health optimization.
This printable hypotension monitoring log provides a comprehensive tool for tracking low blood pressure readings and associated symptoms. Users can systematically document systolic and diastolic levels, pulse rate, and instances of dizziness or fatigue. By maintaining a consistent medical record, patients facilitate better communication with healthcare providers to manage chronic conditions like orthostatic hypotension effectively. Utilizing this template ensures accurate data collection, empowering individuals to identify patterns and optimize treatment plans. Download your log today to prioritize cardiovascular health and long-term wellness.