
Pulse Pressure Analysis Sheet Template for Cardiovascular Monitoring
Monitoring cardiovascular health requires precise documentation of circulatory trends. Utilizing a professional pulse pressure analysis sheet allows users to track the numerical difference between systolic and diastolic values effectively. This specialized health log is essential for evaluating arterial stiffness and overall hemodynamics over time. By maintaining a consistent record of clinical data, individuals and practitioners can identify significant fluctuations in vascular health and improve patient outcomes. Please check the already made variation of templates below.
Pulse Pressure Trend Log
💾 Pulse Pressure Trend Log .xls
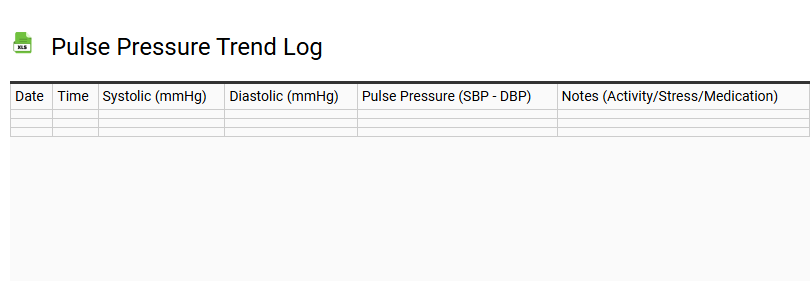
A Pulse Pressure Trend Log is a vital tool for monitoring the numerical difference between systolic and diastolic blood pressure readings. This specific metric reflects the force the heart generates during each contraction, offering critical insights into cardiovascular health and arterial stiffness. By utilizing a structured template, individuals can consistently track hemodynamic fluctuations, providing essential data regarding stroke volume and systemic vascular resistance.
Consistent documentation aids in the clinical assessment of circulatory system efficiency, helping healthcare providers identify risks associated with hypertension or heart failure. This proactive approach to health tracking ensures that blood pressure variations are analyzed over time rather than in isolation. Maintaining an accurate log empowers patients to manage their vascular health effectively, fostering better communication during medical consultations and optimizing long-term preventative care strategies.
Systolic vs Diastolic Gap Calculator
💾 Systolic vs Diastolic Gap Calculator .xls
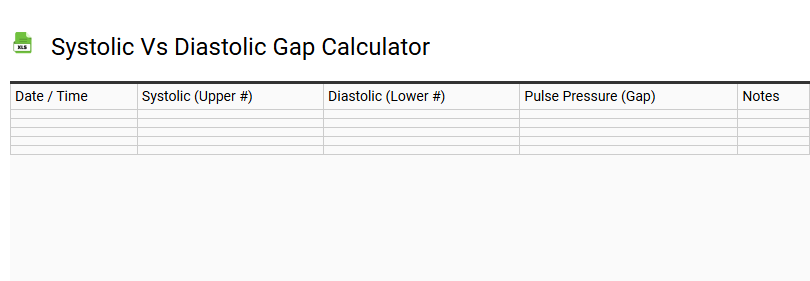
Understanding the numerical difference between your systolic and diastolic blood pressure readings is critical for evaluating cardiovascular health. This measurement, scientifically referred to as pulse pressure, reflects the force the heart generates each time it contracts relative to the resting pressure in the arteries. A wide gap may indicate arterial stiffness or underlying heart disease, while a narrow gap could suggest reduced cardiac output.
By utilizing a systolic vs diastolic gap calculator, users can accurately track their blood pressure readings in mmHg to monitor for signs of hypertension or vascular resistance. consistent monitoring of these vital signs aids in the early detection of risks related to stroke or myocardial infarction. Use this digital tool to analyze your circulatory system's efficiency and maintain optimal vascular wellness through data-driven insights.
Weekly Pulse Pressure Summary
💾 Weekly Pulse Pressure Summary .xls
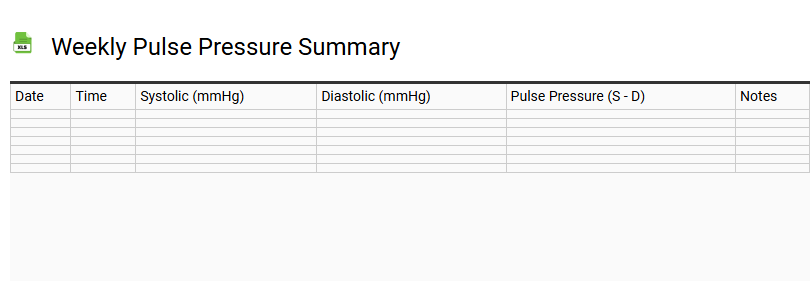
A Weekly Pulse Pressure Summary serves as a vital diagnostic instrument for monitoring hemodynamic stability and cardiovascular health. By calculating the numerical difference between systolic and diastolic blood pressure, this template tracks arterial stiffness and vascular compliance over a seven-day period.
Consistent documentation of these circulatory fluctuations provides essential data for hypertension management and long-term risk assessment. Utilizing a structured log assists in identifying widened pulse pressure or narrowed pulse pressure trends, which are critical indicators of stroke risk and cardiac output efficiency.
This streamlined monitoring tool facilitates proactive clinical evaluation, allowing patients and healthcare providers to observe blood pressure variability and mean arterial pressure correlations. Use this systematic approach to maintain an accurate record of your physiologic response to therapeutic interventions, lifestyle adjustments, or prescribed medications.
Pulse Pressure Variance Tracker
💾 Pulse Pressure Variance Tracker .xls
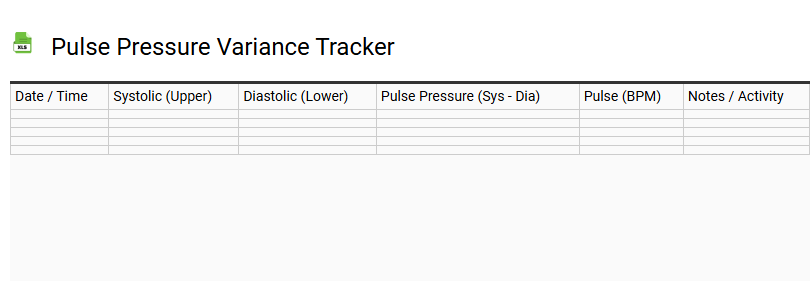
This Pulse Pressure Variance (PPV) Tracker template serves as a vital instrument for hemodynamic monitoring and evaluating fluid responsiveness. By systematically recording fluctuations in the arterial pressure waveform during the respiratory cycle, clinicians can accurately assess preload dependency in patients undergoing mechanical ventilation.
The template captures integrated systolic and diastolic pressure data to calculate the percentage of variance, offering a precise reflection of stroke volume changes. Implementing this structured log enhances clinical decision-making within intensive care environments, guiding intravenous fluid administration strategies. By tracking these essential cardiovascular parameters, healthcare providers can optimize cardiac output and manage circulatory volume effectively, ensuring data-driven patient care and improved physiological stability through real-time monitoring.
Cardiovascular Health Dashboard
💾 Cardiovascular Health Dashboard .xls
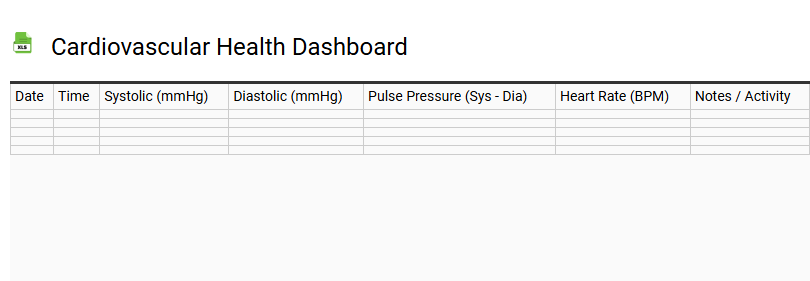
This cardiovascular health dashboard provides a centralized interface for monitoring critical circulatory vitals and biometric data. Designed for clinical precision, the template integrates real-time tracking of systolic and diastolic blood pressure, resting heart rate, and oxygen saturation (SpO2) levels. Users can visualize fluctuations in serum cholesterol, including LDL and HDL ratios, alongside lipid profiles to assess long-term coronary risk factors.
The dashboard incorporates ECG telemetry summaries and heart rate variability (HRV) analytics to detect early signs of arrhythmia. By synthesizing physical activity metrics with sedentary behavior alerts, the system promotes proactive hypertension management. Advanced data visualizations offer insights into cardiac output and arterial stiffness, empowering patients and healthcare providers to optimize myocardial efficiency. This responsive health portal ensures seamless EHR integration for comprehensive vascular wellness and preventative cardiac care.
Blood Pressure and Pulse Pressure History
💾 Blood Pressure and Pulse Pressure History .xls
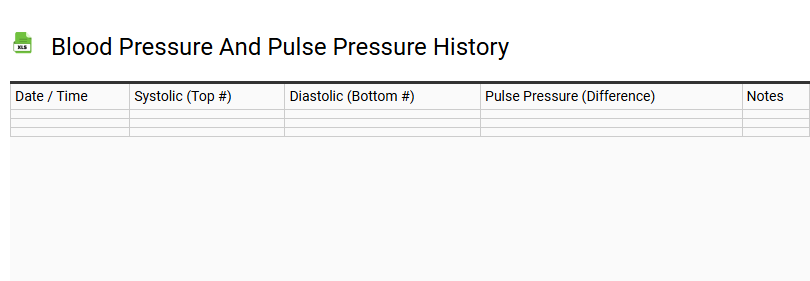
Utilizing a comprehensive blood pressure and pulse pressure history template is essential for precise cardiovascular health monitoring. This structured log allows individuals to record systolic and diastolic readings, facilitating the calculation of pulse pressure-a critical indicator of arterial stiffness and hemodynamic health. By maintaining a consistent vital signs log, patients can identify hypertension trends and circulatory system irregularities over time. This medical record serves as a vital tool during clinical consultations, providing healthcare providers with accurate longitudinal data from sphygmomanometer measurements. Tracking heart rate and arterial pressure fluctuations helps in evaluating the efficacy of antihypertensive treatments and managing overall vascular wellness. Using a standardized health tracking sheet ensures that cardiovascular events are mitigated through proactive data-driven wellness and preventative medicine strategies.
Daily Hemodynamic Analysis Sheet
💾 Daily Hemodynamic Analysis Sheet .xls
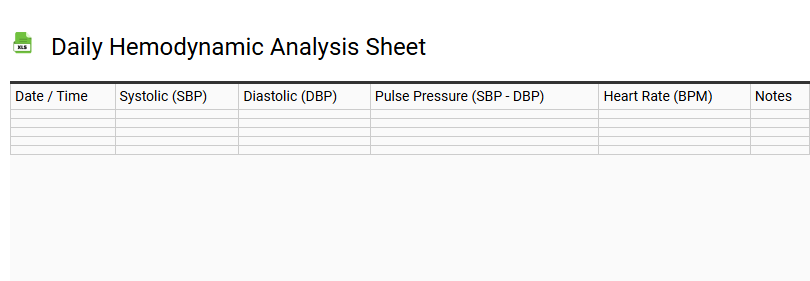
A daily hemodynamic analysis sheet serves as a vital clinical tool for continuous cardiovascular monitoring within intensive care environments. This structured template facilitates the systematic tracking of vital signs alongside advanced metrics such as mean arterial pressure (MAP), cardiac output (CO), and stroke volume. By documenting systemic vascular resistance (SVR) and pulmonary artery wedge pressure, healthcare providers can accurately assess tissue perfusion and fluid status.
- Monitor hemodynamic stability through real-time invasive data.
- Evaluate oxygen delivery and vascular tone adjustments.
- Track vasopressor titration and fluid resuscitation efficacy.
Utilizing this comprehensive record ensures precise patient assessment, allowing for rapid intervention based on arterial line or Swan-Ganz catheter readings. It optimizes critical care workflows by consolidating complex physiological data into an actionable diagnostic summary for the medical team.
Long-term Pulse Pressure Monitor
💾 Long-term Pulse Pressure Monitor .xls
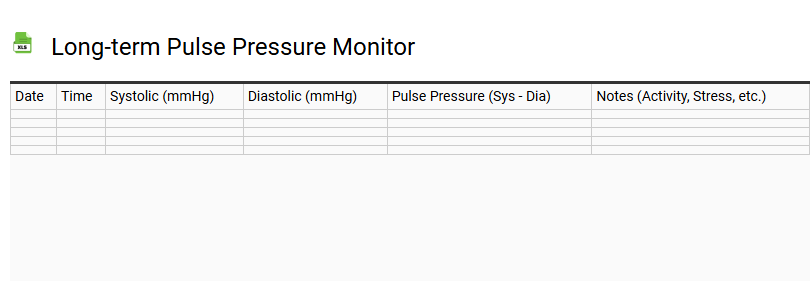
A Long-term Pulse Pressure Monitor serves as a vital tool for tracking the numerical difference between systolic and diastolic blood pressure over extended durations. This specific metric offers critical insights into cardiovascular elasticity and overall heart health. By utilizing this structured template, users can consistently record daily readings, allowing healthcare providers to identify trends related to arterial stiffness or potential hypertensive risks.
The interface facilitates seamless data entry for time-stamped measurements, ensuring high accuracy for clinical reviews. Monitoring these fluctuations helps in managing chronic conditions and optimizing therapeutic interventions. This documentation format simplifies complex physiological data into a clear, chronological history. It empowers individuals to participate actively in their wellness journey while providing physicians with the comprehensive datasets necessary for informed medical decision-making and proactive preventative care strategies.
Arterial Health Tracking Spreadsheet
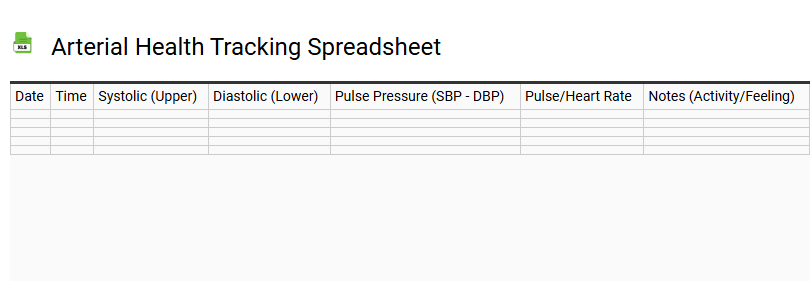
💾 Arterial Health Tracking Spreadsheet .xls
An arterial health tracking spreadsheet serves as a comprehensive digital health log for proactive cardiovascular wellness. By systematically recording daily blood pressure readings-specifically systolic and diastolic metrics-users can effectively assist in hypertension management. This data-driven tool enables the monitoring of arterial stiffness and pulse wave velocity, providing critical insights into vascular elasticity and overall circulatory system function.
- Monitor lipid profile data, including HDL/LDL cholesterol and triglycerides.
- Visualize biometric trends to identify early markers of atherosclerosis.
- Maintain a detailed history for heart disease prevention and clinical consultations.
Leveraging data visualization features helps pinpoint fluctuations in vascular health, ensuring informed lifestyle adjustments. This template streamlines oversight, transforming raw metrics into actionable cardiac health insights for improved hemodynamic stability and long-term longevity.
Hypertensive Pulse Pressure Record
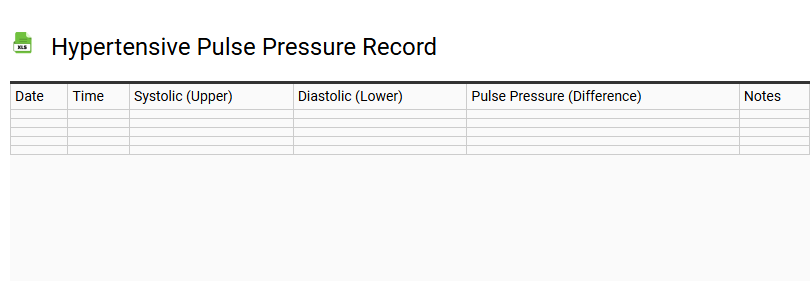
💾 Hypertensive Pulse Pressure Record .xls
A hypertensive pulse pressure record serves as a vital diagnostic tool for monitoring cardiovascular health and arterial stiffness. By documenting the numerical difference between systolic and diastolic blood pressure readings measured in mmHg, patients can identify patterns of vascular compliance. A widening gap often signals increased hemodynamic stress or underlying hypertension complications.
Utilizing a structured monitoring log ensures accurate data collection for clinical review. This template facilitates the tracking of:
- Systolic pressure (peak arterial force)
- Diastolic pressure (resting arterial force)
- Calculated pulse pressure values
- Daily heart rate (BPM) and time-stamps
Consistent use of a sphygmomanometer combined with precise data logging assists healthcare providers in refining medication management and evaluating circulatory health. Maintaining this record is a proactive step in managing cardiovascular risk and ensuring long-term heart health stability.
Morning and Evening Pulse Pressure Log
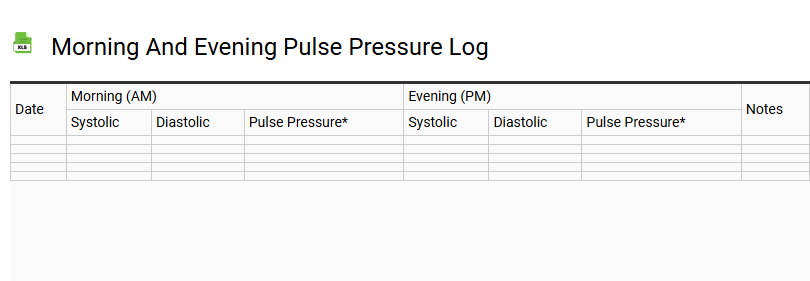
💾 Morning and Evening Pulse Pressure Log .xls
This morning and evening pulse pressure log serves as a vital tool for comprehensive cardiovascular health monitoring. By systematically recording systolic and diastolic readings twice daily, users can effectively track arterial health and identify potential hypertension trends.
Maintaining a consistent log provides essential clinical data for healthcare providers to evaluate the circulatory system's efficiency. Frequent tracking of heart rate and pulse pressure-calculated as the numerical difference between the two primary blood pressure values-is crucial for long-term wellness.
Utilizing this structured template ensures accurate documentation of daily fluctuations, allowing for proactive adjustments in lifestyle or medication. Consistent daily monitoring is a fundamental component of effective hypertension management and overall heart health assessment.
Automated Pulse Pressure Ratio Sheet
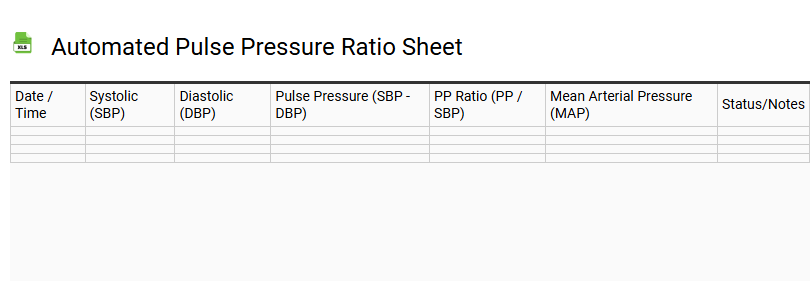
💾 Automated Pulse Pressure Ratio Sheet .xls
An automated pulse pressure ratio sheet streamlines hemodynamic monitoring by instantly calculating the numerical difference between systolic blood pressure and diastolic blood pressure. Utilizing dynamic formulas, this digital template tracks arterial compliance and cardiovascular health indicators, reducing manual computation errors in clinical environments. This tool is essential for assessing stroke volume variations and arterial stiffness through precise data entry.
By leveraging integrated spreadsheets, healthcare providers can perform real-time hemodynamic profiling. These templates often include features for:
- Tracking mean arterial pressure (MAP) trends.
- Visualizing longitudinal cardiovascular risk data.
- Automating systolic-diastolic gradients for rapid diagnostic insights.
Implementing a structured automated monitoring log ensures consistent patient oversight, facilitating data-driven decisions in critical care and chronic hypertension management. This optimized digital solution enhances clinical workflow efficiency while maintaining high standards of diagnostic accuracy.
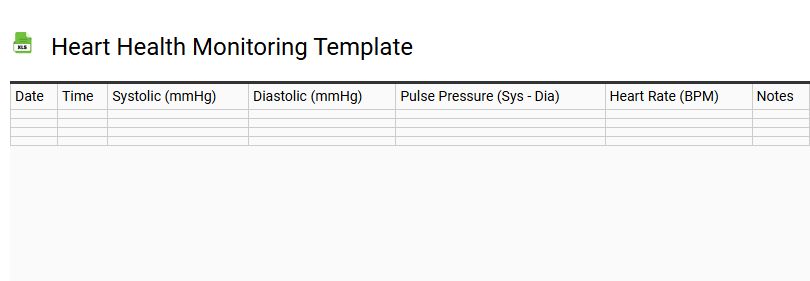
Heart Health Monitoring Template
💾 Heart Health Monitoring Template .xls
This heart health monitoring template provides a comprehensive framework for tracking cardiovascular wellness and essential vital signs. Designed for proactive cardiac care, the layout facilitates the organized logging of blood pressure readings, resting pulse rates, and heart rate variability (HRV) to gain deeper biometric insights. Users can efficiently document cholesterol levels, EKG data, and physical activity, ensuring a holistic view of circulatory health.
By utilizing this structured approach, individuals can identify physiological trends, manage chronic conditions, and share precise health metrics with medical professionals. The template streamlines preventive care through consistent observation of systolic and diastolic pressure. Optimized for both patients and fitness enthusiasts, this digital tool fosters long-term wellness through informed, data-driven decisions and meticulous tracking of cardiac performance indicators.
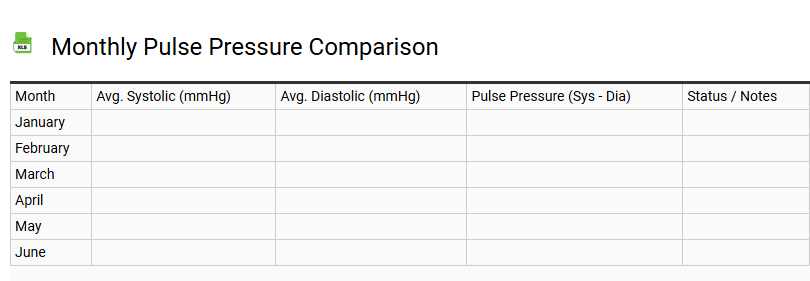
Monthly Pulse Pressure Comparison
💾 Monthly Pulse Pressure Comparison .xls
A Monthly Pulse Pressure Comparison template is a critical instrument for evaluating long-term cardiovascular health and arterial efficiency. By calculating the numerical variance between systolic and diastolic readings, this log identifies arterial stiffness and fluctuations in stroke volume. Tracking these hemodynamic trends over a thirty-day cycle aids in hypertension management and the early detection of vascular resistance issues.
Utilizing a structured format for blood pressure monitoring ensures that users can visualize circulatory wellness and heart function consistency. This longitudinal data is essential for medical consultations, providing a clear overview of cardiac output and potential cardiovascular risk factors. Consistent documentation transforms isolated measurements into actionable insights, promoting proactive heart health strategies and informed lifestyle adjustments based on precise pulse pressure metrics.
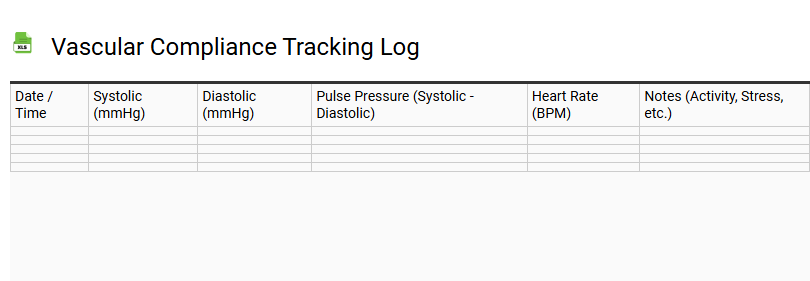
Vascular Compliance Tracking Log
💾 Vascular Compliance Tracking Log .xls
A Vascular Compliance Tracking Log serves as a vital clinical instrument for monitoring arterial elasticity and systemic hemodynamic profiles. This template facilitates the systematic recording of pulse wave velocity (PWV) and augmentation indices to evaluate arterial stiffness and vessel wall integrity over time.
By documenting longitudinal data including blood pressure fluctuations, cardiac output, and peripheral resistance, healthcare providers can gain insights into a patient's cardiovascular health. Precise tracking of these physiological metrics is essential for assessing the efficacy of therapeutic interventions and lifestyle adjustments aimed at reducing vascular strain.
Utilizing this log ensures a comprehensive overview of systolic and diastolic trends, supporting early detection of hypertensive changes. This structured approach to data collection enhances the management of arterial remodeling and optimizes long-term prognostic outcomes through consistent monitoring of total peripheral compliance.
This pulse pressure analysis sheet provides a structured template for tracking the numerical difference between systolic and diastolic readings. By monitoring these hemodynamic trends, clinicians and patients can identify potential arterial stiffness or cardiovascular risk factors early.
Utilizing this log ensures precise data collection for medical consultations, enhancing hypertension management and vascular health assessment. Regular documentation of these circulatory metrics supports proactive heart health maintenance and informed therapeutic adjustments.