
Weekly Blood Pressure Journal Template for Monitoring Heart Health
Maintaining optimal cardiovascular health requires consistent monitoring of your vital signs. A dedicated template for a weekly blood pressure journal helps you systematically record systolic and diastolic readings alongside your pulse rate. By logging these daily measurements, you can identify hypertension trends and provide healthcare professionals with accurate clinical data. This organized approach to medical tracking simplifies long-term health management and ensures you stay proactive regarding your heart health. Please explore our diverse selection of professionally designed templates below to find the perfect format for your needs.
Simple Weekly Log
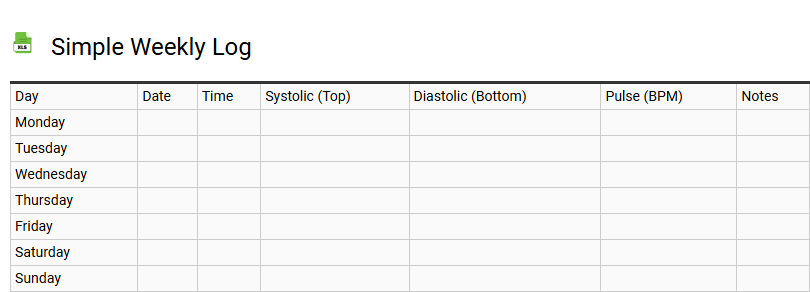
A simple weekly log serves as a vital productivity tool for effective time management and performance tracking. By utilizing a structured layout, users can document daily tasks, key milestones, and professional accomplishments within a single organizational framework. This streamlined approach enhances workflow transparency, allowing for consistent progress monitoring and goal alignment.
Incorporating a weekly review process facilitates habit tracking and identifies areas for continuous improvement. Whether used for personal accountability or team status reports, a well-designed template simplifies record-keeping and boosts overall efficiency. By consolidating vital information, individuals can reflect on their weekly output, prioritize upcoming objectives, and maintain a clear overview of their long-term growth. Implementing this routine ensures that important details are never overlooked, fostering a disciplined habit of reflection and strategic planning for the week ahead.
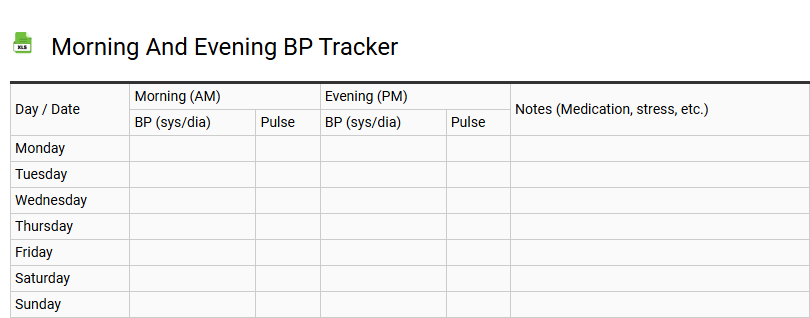
Morning and Evening BP Tracker
💾 Morning and Evening BP Tracker .xls
Utilizing a comprehensive Morning and Evening BP Tracker is essential for effective hypertension management and proactive cardiovascular health monitoring. This structured blood pressure log allows individuals to record precise systolic and diastolic readings alongside their resting pulse rate. By capturing data twice daily, users can identify patterns such as morning surges or nocturnal fluctuations within the circulatory system.
Maintaining a digital or printed health diary provides medical professionals with high-quality medical records, facilitating more accurate diagnostic insights. An optimized tracking template should include:
- Dedicated slots for AM and PM timestamps.
- Columns for mean arterial pressure calculations.
- Sections for medication adherence and lifestyle triggers.
Consistent daily monitoring via a dedicated hypertension diary empowers patients to visualize trends, ensuring better long-term management of arterial tension and overall heart wellness through reliable, data-driven observations.
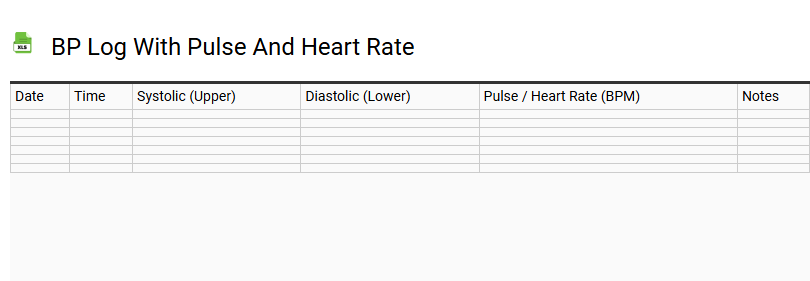
BP Log with Pulse and Heart Rate
💾 BP Log with Pulse and Heart Rate .xls
A comprehensive BP log with pulse and heart rate serves as a vital diagnostic tool for monitoring cardiovascular health. By consistently recording systolic and diastolic measurements alongside your pulse rate, you create a detailed medical history of your circulatory system. This template facilitates effective hypertension management, allowing users to track beats per minute (BPM) and identify fluctuations in arterial pressure.
Utilizing a structured blood pressure tracker ensures accurate vital signs documentation. Key benefits of daily monitoring include:
- Tracking resting heart rate trends and irregularities.
- Identifying hypertensive triggers through longitudinal data.
- Improving clinical outcomes via precise cardiac performance insights.
Maintaining this health record assists healthcare providers in assessing vascular resistance and adjusting wellness plans to prevent cardiovascular disease effectively.
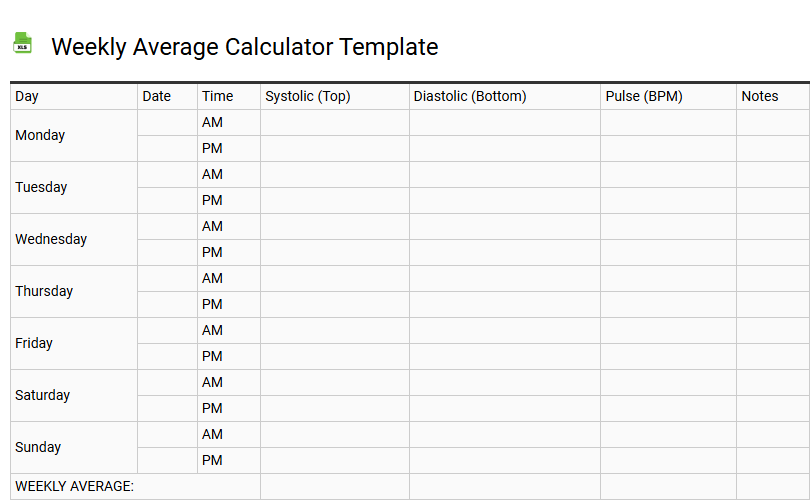
Weekly Average Calculator Template
💾 Weekly Average Calculator Template .xls
This weekly average calculator template streamlines the process of determining the arithmetic mean across a consistent seven-day period. By optimizing data entry for daily inputs, users can efficiently monitor performance metrics and identify significant trend identification within their unique datasets.
Whether tracking financial expenditures, health statistics, or business productivity, this tool provides precise numerical insights through automated formulas. The structured spreadsheet format ensures consistency in periodic reporting, allowing for the accurate aggregation of fluctuating values.
Designed for data tracking, this template transforms raw figures into actionable summaries. Enhance your analytical workflow by leveraging calculated results to make informed decisions based on a comprehensive statistical analysis of your weekly performance and variable logs.
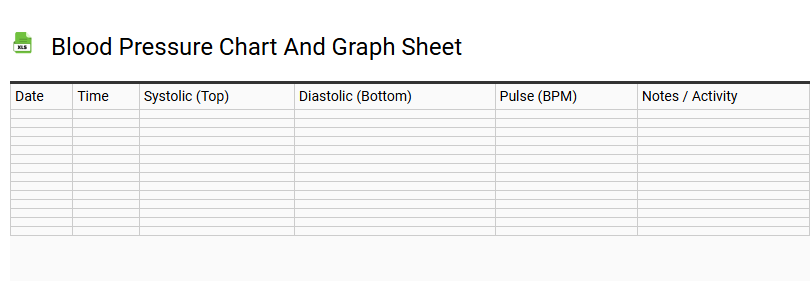
Blood Pressure Chart and Graph Sheet
💾 Blood Pressure Chart and Graph Sheet .xls
This comprehensive blood pressure chart and graph sheet serves as a vital medical record for monitoring cardiovascular health. By utilizing this tracking log, users can meticulously document daily systolic and diastolic readings, measured in mmHg, alongside pulse rate. This digital template facilitates accurate trend analysis, helping healthcare providers identify patterns of hypertension or hypotension over time.
Whether used as a printable logbook or an electronic file, consistent data entry ensures precise vital sign management. Maintaining a clear visual representation of circulatory data empowers patients to make informed lifestyle adjustments. This BP monitoring tool is essential for anyone tracking heart health metrics, providing a structured format for recording periodic sphygmomanometer results and ensuring long-term wellness through proactive observation and data-driven medical consultations.
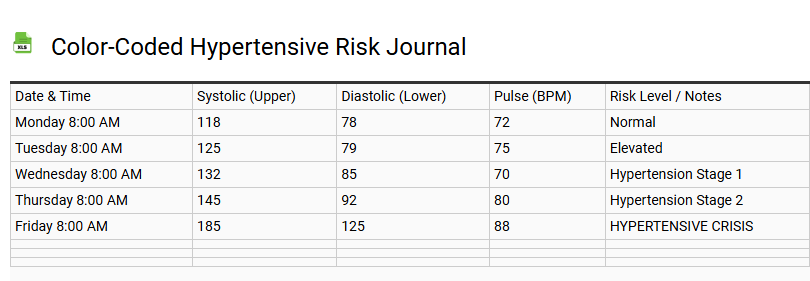
Color-Coded Hypertensive Risk Journal
💾 Color-Coded Hypertensive Risk Journal .xls
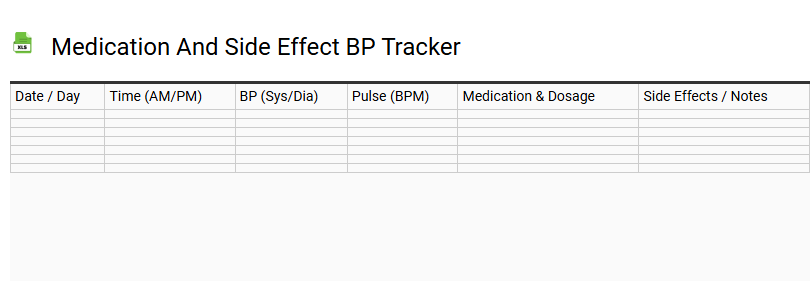
Medication and Side Effect BP Tracker
💾 Medication and Side Effect BP Tracker .xls
A comprehensive Medication and Side Effect BP Tracker serves as a vital clinical tool for managing hypertension and cardiovascular wellness. This structured template facilitates the precise logging of systolic and diastolic readings alongside pulse rate metrics. By integrating pharmaceutical adherence records, patients can correlate specific dosage timings with fluctuations in arterial pressure.
Monitoring adverse reactions or secondary symptoms ensures a detailed health journal for medical consultations. Utilizing this blood pressure log enhances patient outcomes by identifying potential drug interactions or the efficacy of antihypertensive therapy. Consistent documentation of heart rate variability and medication frequency empowers individuals to maintain a transparent medical history, streamlining communication with healthcare providers for optimized chronic disease management and necessary therapeutic adjustments.
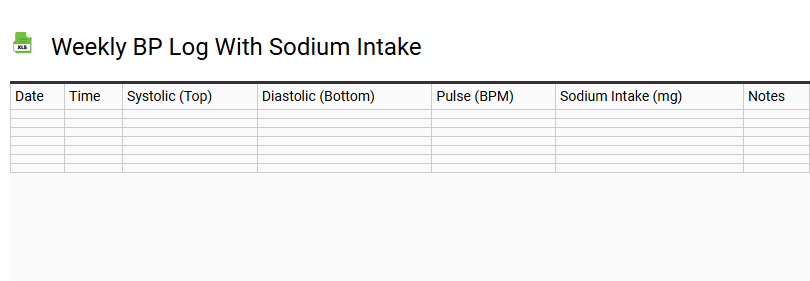
Weekly BP Log with Sodium Intake
💾 Weekly BP Log with Sodium Intake .xls
Effective hypertension management relies on consistent blood pressure monitoring and the careful tracking of sodium intake. This weekly BP log provides a structured format to record systolic and diastolic readings, alongside daily milligram (mg) counts of salt consumption. By documenting resting heart rate and dietary patterns, you can identify how sodium consumption directly impacts your cardiovascular health.
Utilizing a digital tracking template simplifies the process of spotting blood pressure trends over a seven-day period. This data is essential for those following a DASH diet or managing chronic high blood pressure. Accurate health records facilitate more productive consultations with medical professionals, ensuring that lifestyle interventions and dietary habits are effectively lowering your risks and improving overall arterial function.
Systolic and Diastolic Trend Tracker
💾 Systolic and Diastolic Trend Tracker .xls
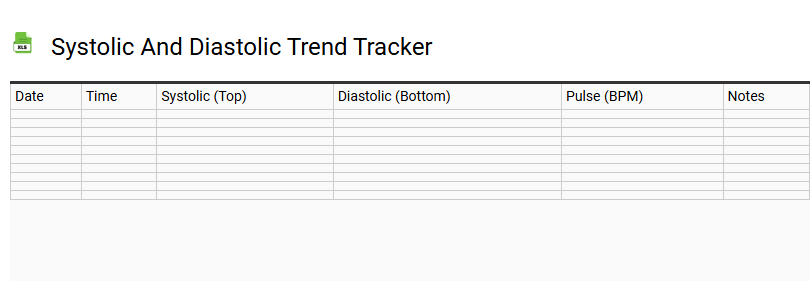
This systolic and diastolic trend tracker serves as a vital tool for comprehensive cardiovascular health monitoring. By systematically logging blood pressure readings, users can visualize the force exerted against arterial walls during both heart contractions and rest periods. This template facilitates the identification of hypertension patterns or hypotension risks through consistent data entry.
Integrating pulse rate tracking alongside sphygmomanometer results provides a holistic view of the circulatory system. Maintaining a detailed medical diary allows for the early detection of cardiac health fluctuations, offering healthcare professionals precise clinical data for diagnostic insights. Using this structured blood pressure log ensures that vital signs are monitored accurately over time, supporting long-term wellness management and heart disease prevention through organized data visualization of daily physiological metrics.
Doctor-Ready Weekly Summary Sheet
💾 Doctor-Ready Weekly Summary Sheet .xls
Printable Weekly Blood Pressure Diary
💾 Printable Weekly Blood Pressure Diary .xls
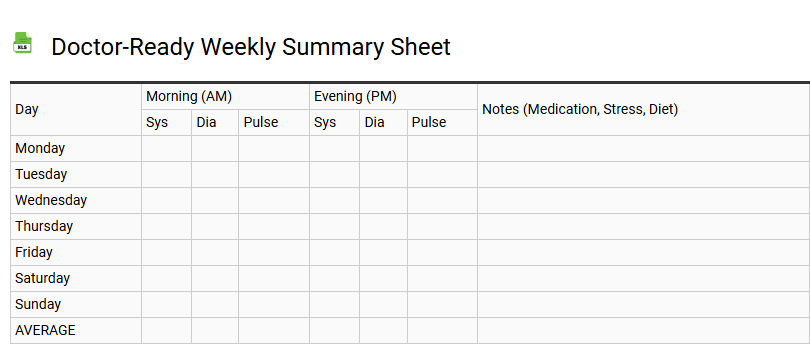
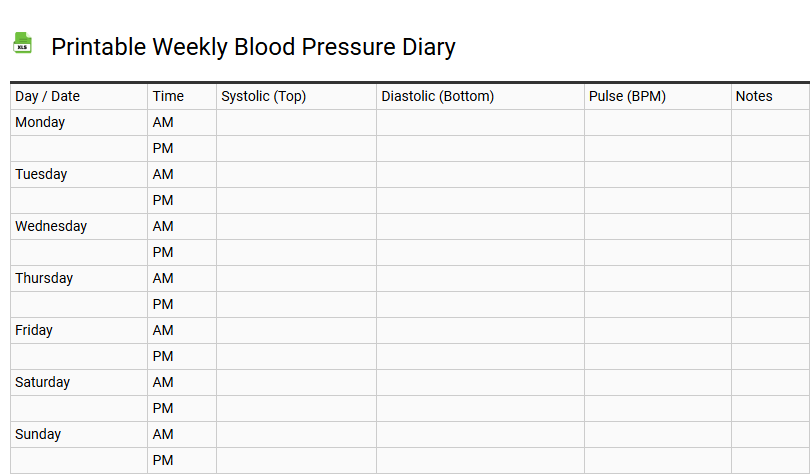
Utilizing a printable weekly blood pressure diary is an essential strategy for effective hypertension management and proactive cardiovascular health monitoring. This structured log sheet empowers users to record critical systolic and diastolic measurements alongside heart rate data. By conducting daily monitoring, individuals can capture morning and evening fluctuations, creating a comprehensive medical record ready for a physician review.
This tracking tool simplifies the observation of trends in arterial tension and pulse pressure. An organized blood pressure log ensures that vital health metrics are documented accurately, assisting in clinical diagnosis and medication adjustments. Whether managing chronic conditions or focusing on vascular wellness, this template provides a clear framework for documenting vital signs. Consistent data entry fosters informed communication with healthcare professionals, ensuring that circulatory health remains a top priority through precise, manual data collection.
Automated Health Status Indicator Log
💾 Automated Health Status Indicator Log .xls
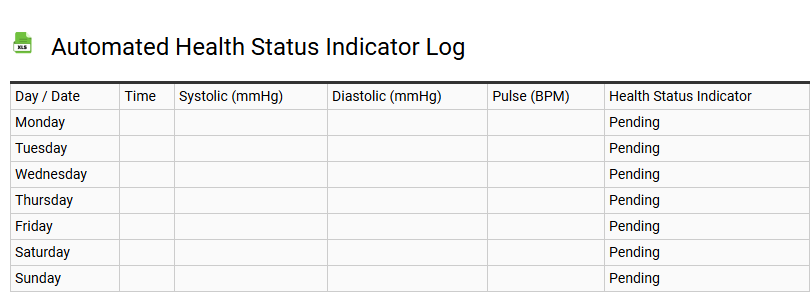
This automated health status indicator log template provides a robust framework for real-time tracking of critical system performance metrics. Designed for optimal infrastructure visibility, it captures vital diagnostic data, error logs, and server heartbeats to ensure maximum uptime monitoring. By centralizing Key Performance Indicators (KPIs), the log facilitates proactive system maintenance and streamlined incident management. This logging framework integrates seamlessly with alerting systems, documenting resource utilization and latency trends for IT operations. Utilizing this standardized format creates a comprehensive audit trail, enhancing troubleshooting efficiency across cloud or on-premise environments. Implementing this automated reporting mechanism ensures operational health is consistently monitored, allowing for rapid response to technical anomalies and maintaining high service reliability.
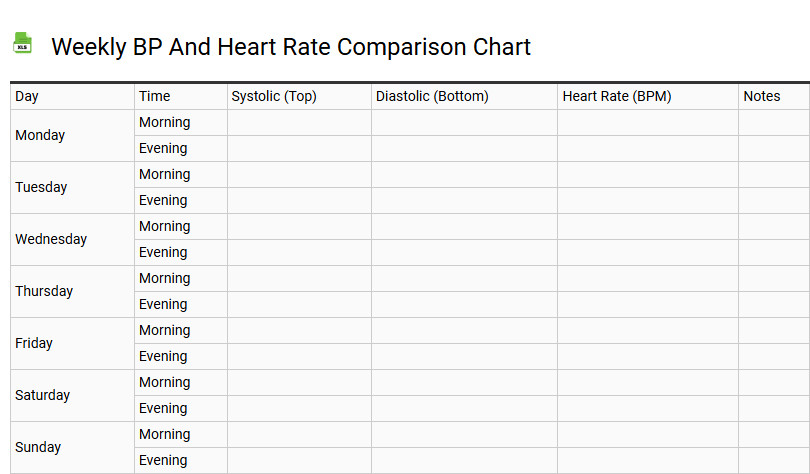
Weekly BP and Heart Rate Comparison Chart
💾 Weekly BP and Heart Rate Comparison Chart .xls
A comprehensive Weekly BP and Heart Rate Comparison Chart serves as a vital tool for proactive cardiovascular health management. This template allows users to systematically record systolic and diastolic levels alongside their resting pulse rate. By documenting daily readings, individuals can visualize significant health trends and arterial pressure variability over a seven-day period.
Utilizing a structured medical log facilitates accurate hypertension monitoring and provides essential biometric data for professional physician reviews. Consistent digital tracking of these vital signs helps establish a personal health baseline, ensuring that any irregular fluctuations are identified early. This streamlined approach to vital sign documentation supports informed lifestyle adjustments and improves overall circulatory wellness through detailed data visualization and rhythm analysis.
A weekly blood pressure journal template is an essential tool for effective hypertension tracking and cardiovascular health monitoring. By documenting daily systolic and diastolic readings alongside heart rate data, you create a comprehensive medical log for clinical review.
This structured approach to hypertension management facilitates better data visualization during doctor consultations. Utilizing a consistent health tracking log empowers proactive wellness, ensuring accurate records for informed medical decisions and sustained long-term heart health.