
Weight Loss Plateau Analysis Sheet Template: Identifying and Overcoming Stalled Progress
Overcoming a stagnant scale requires a strategic approach. A weight loss plateau analysis sheet serves as a vital diagnostic tool for identifying metabolic adaptation or inconsistencies in caloric tracking. By meticulously logging nutritional intake, physical activity levels, and sleep patterns, you can pinpoint exactly why progress has stalled. Utilizing a structured template helps differentiate between water retention and true fat loss stalls. Refine your journey by evaluating these critical data points systematically. Check out our professionally designed variations of templates below to jumpstart your breakthrough.
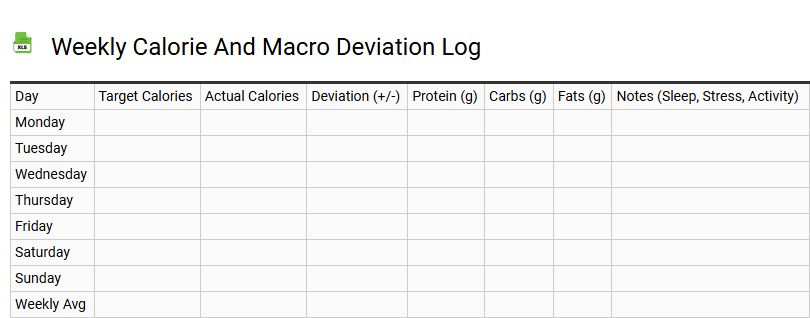
Weekly Calorie and Macro Deviation Log
💾 Weekly Calorie and Macro Deviation Log .xls
A weekly calorie and macro deviation log serves as a critical tool for precise nutritional tracking and long-term dietary adherence. By meticulously documenting the variance between target goals and actual consumption, individuals can better manage their energy balance and metabolic health.
This template facilitates the monitoring of key metrics, including:
- Macronutrient distribution: Balancing protein, carbohydrates, and lipids.
- Caloric surplus or deficit: Aligning intake with body composition goals.
- Nutritional variance: Identifying patterns in meal planning inconsistencies.
- Metabolic adaptation: Adjusting targets based on weekly performance data.
Consistent use of this log provides data-driven insights into how macronutrient ratios influence satiety and performance. Tracking these fluctuations allows for strategic adjustments to daily energy expenditure, ensuring that fitness objectives remain attainable through disciplined nutritional management and refined macro counting strategies.
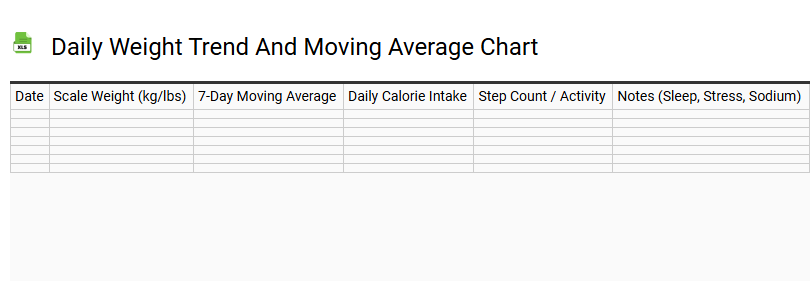
Daily Weight Trend and Moving Average Chart
💾 Daily Weight Trend and Moving Average Chart .xls
Utilizing a daily weight trend and moving average chart is essential for navigating the physiological noise of body mass fluctuations. Standard scale measurements often vary due to hydration, glycogen levels, or inflammation; however, a moving average calculation provides a smoothed visualization of your actual progress. This template tracks weight loss trends and fitness metrics by aggregating daily logs into a consistent, actionable data stream.
By focusing on the seven-day mean, users can identify long-term trajectories rather than reacting to temporary spikes. This data-driven approach to health monitoring integrates seamlessly into any wellness routine, offering a reliable baseline for caloric adjustments and metabolic tracking. Incorporating trend analysis into your tracking log ensures that body composition changes are interpreted with mathematical precision, fostering sustainable habits and informed decision-making for long-term physical transformation.
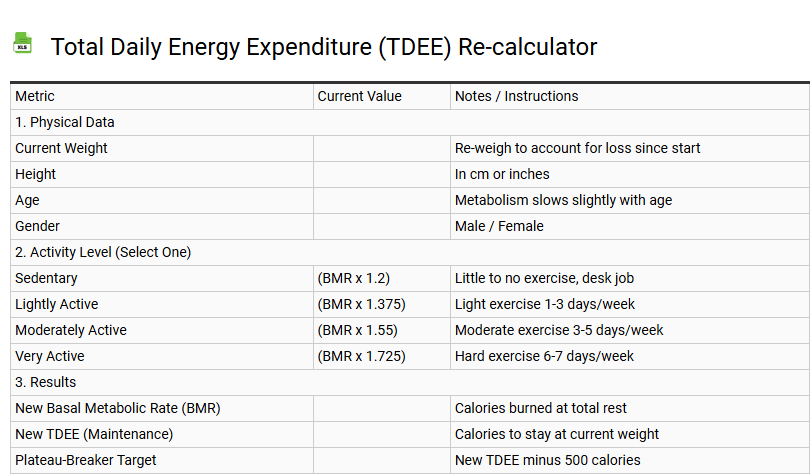
Total Daily Energy Expenditure (TDEE) Re-calculator
💾 Total Daily Energy Expenditure (TDEE) Re-calculator .xls
Precision in weight management requires a dynamic understanding of your Total Daily Energy Expenditure (TDEE). This re-calculator template functions by synthesizing your Basal Metabolic Rate (BMR) with your current physical activity level (PAL) to determine your exact maintenance calories. As body composition shifts through fat loss or muscle gain, your metabolic rate evolves, making regular recalibration essential for maintaining an optimal energy balance.
By accounting for the thermic effect of food (TEF) and non-exercise activity thermogenesis (NEAT), this tool provides a comprehensive snapshot of your daily caloric intake needs. Whether your goal is a caloric deficit for cutting or a surplus for hypertrophy, tracking these biometric variables prevents weight loss plateaus. Utilize this data-driven approach to adjust your macronutrient distribution and refine your fitness regimen for long-term metabolic health and sustainable results.
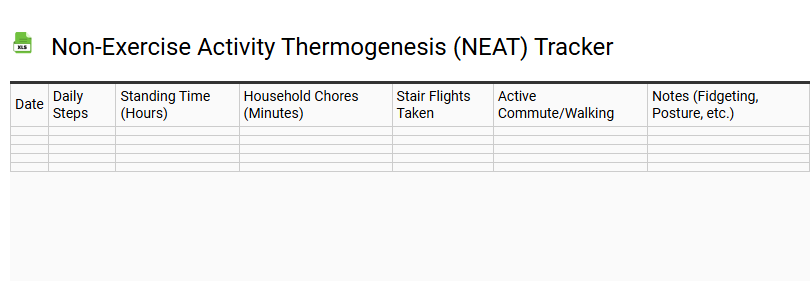
Non-Exercise Activity Thermogenesis (NEAT) Tracker
💾 Non-Exercise Activity Thermogenesis (NEAT) Tracker .xls
Optimizing your metabolic rate requires monitoring Non-Exercise Activity Thermogenesis (NEAT), the energy expended for everything we do that is not sleeping, eating, or sports-like exercise. This comprehensive tracker template helps quantify daily energy expenditure derived from spontaneous movements such as walking, standing, and fidgeting. By logging these low-intensity physical activities, users gain insights into their Total Daily Energy Expenditure (TDEE) beyond structured workouts.
Consistent tracking of daily step counts and active minutes combats a sedentary lifestyle, effectively boosting calorie burn without increasing exercise fatigue. This data-driven approach assists in weight management by identifying fluctuations in non-exercise thermogenesis. Utilizing this tool bridges the gap between basal metabolic rate (BMR) and fitness sessions, ensuring sustained metabolic health through improved habitual movement patterns and increased energy output.
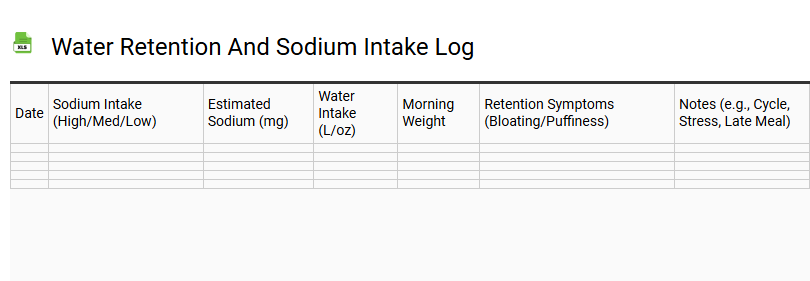
Water Retention and Sodium Intake Log
💾 Water Retention and Sodium Intake Log .xls
Tracking daily salt consumption is essential for managing fluid balance and minimizing systemic edema. This sodium intake log enables users to monitor milligrams of sodium derived from processed foods and hidden dietary sources. By documenting nutritional habits alongside daily weight fluctuations, individuals can identify direct correlations between high mineral intake and uncomfortable bloating.
Maintaining precise records supports cardiovascular health and kidney function by highlighting patterns in cellular osmosis and hydration levels. Monitoring your electrolyte balance provides a comprehensive overview of how dietary sodium affects water retention throughout the body. Use this template to establish a baseline for metabolic wellness and optimize long-term physiological outcomes through disciplined nutritional tracking and data-driven dietary adjustments.
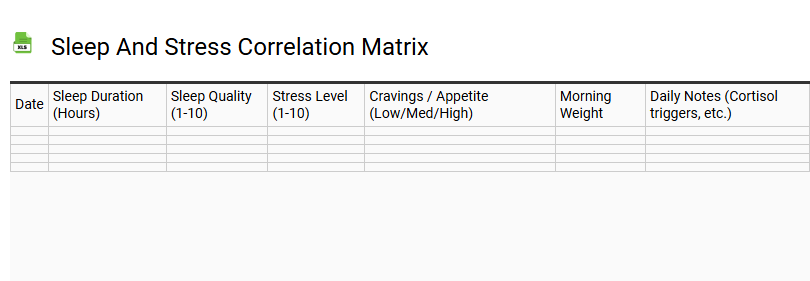
Sleep and Stress Correlation Matrix
💾 Sleep and Stress Correlation Matrix .xls
A Sleep and Stress Correlation Matrix provides a structured framework for analyzing the bidirectional relationship between rest quality and daily tension. This tool allows for the systematic tracking of variables such as sleep duration, latency, and perceived recovery alongside fluctuating levels of psychological or physical pressure.
By documenting these data points over time, individuals can visualize how specific stressors impact circadian rhythms or how sleep deprivation lowers emotional resilience. Typical elements within this template include:
- Rest Indicators: Total hours, sleep efficiency ratings, and morning alertness.
- Stress Drivers: Workload intensity, physical symptoms, and mental fatigue scores.
- Lifestyle Variables: Caffeine intake, exercise frequency, and evening screen exposure.
Using this matrix helps identify recurring patterns, enabling evidence-based adjustments to daily habits to improve overall well-being and break the cycle of chronic exhaustion.
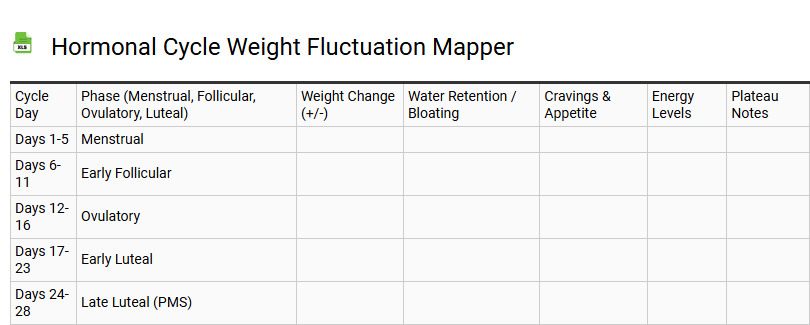
Hormonal Cycle Weight Fluctuation Mapper
💾 Hormonal Cycle Weight Fluctuation Mapper .xls
Tracking physiological shifts through a Hormonal Cycle Weight Fluctuation Mapper is essential for understanding how estrogen and progesterone influence daily body composition. Throughout the menstrual cycle, fluctuations in these steroid hormones can trigger significant water retention and temporary fluid accumulation, often resulting in menstrual weight gain that is easily mistaken for fat accumulation.
By monitoring data across the follicular phase, ovulation, and the luteal phase, users can identify predictable patterns related to:
- Premenstrual bloating and increased sodium sensitivity.
- Changes in resting metabolic rate and appetite triggers.
- Periodic edema driven by the endocrine system.
This data-driven approach to weight tracking provides a clear perspective on biological rhythms. Utilizing this tool helps differentiate between actual tissue mass and hormone-induced water weight, promoting better metabolic health and realistic expectations during various menstrual phases.
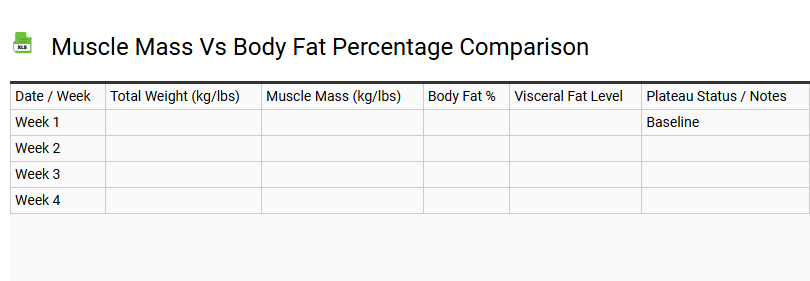
Muscle Mass vs Body Fat Percentage Comparison
💾 Muscle Mass vs Body Fat Percentage Comparison .xls
Understanding the dynamic relationship between muscle mass and body fat percentage is essential for accurate body composition analysis. Unlike a standard scale, evaluating the ratio of lean tissue to adipose tissue provides a comprehensive view of physical health. Increasing skeletal muscle through resistance training and hypertrophy significantly boosts the basal metabolic rate (BMR), as muscle is more metabolically active than fat.
Tracking these metrics via DEXA scans, skinfold calipers, or bioelectrical impedance allows for effective body recomposition. By focusing on the muscle-to-fat ratio rather than just BMI, individuals can optimize metabolic health and functional strength. Reducing visceral fat while preserving lean mass ensures long-term vitality. This template facilitates precise monitoring of lipid stores and protein synthesis to achieve peak athletic performance and a sustainable caloric deficit.
Dietary Fiber and Digestion Log
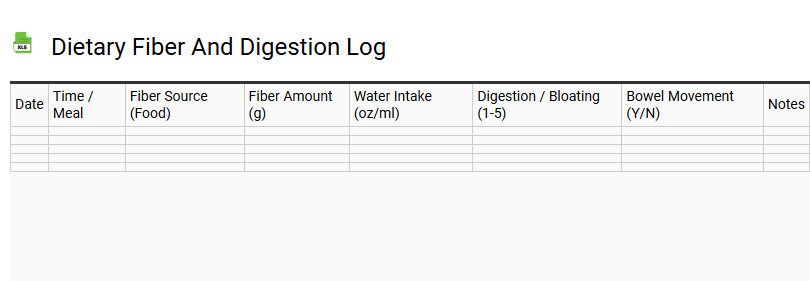
💾 Dietary Fiber and Digestion Log .xls
Utilizing a dietary fiber and digestion log is essential for optimizing gastrointestinal health and monitoring nutrient absorption. This tracking template helps identify the balance between soluble fiber, which aids in blood sugar regulation, and insoluble fiber, which improves transit time.
By documenting daily intake, you can correlate specific food groups with physiological responses, such as:
- Stool consistency and frequency of bowel movements.
- Occurrences of bloating, gas, or abdominal discomfort.
- The efficacy of prebiotic foods on your gut microbiome.
Consistent monitoring supports colon health by ensuring adequate roughage is consumed to prevent constipation. This data-driven food diary empowers users to make precise adjustments to their nutritional habits, fostering a resilient digestive system and enhanced metabolic wellness through informed dietary choices.
Exercise Intensity and Heart Rate Zone Tracker
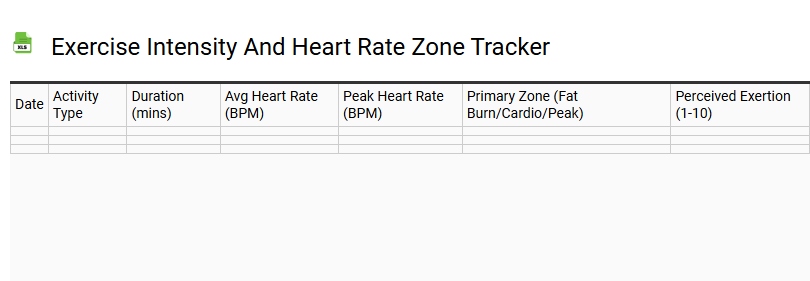
💾 Exercise Intensity and Heart Rate Zone Tracker .xls
This Exercise Intensity and Heart Rate Zone Tracker is a professional tool designed to quantify cardiorespiratory fitness and athletic performance. By monitoring beats per minute (BPM), users can accurately gauge exertion levels relative to their Maximum Heart Rate (MHR) and resting pulse. This template facilitates the categorization of physical activity into specific physiological tiers, including the fat-burn zone, aerobic capacity building, and anaerobic threshold training.
Incorporating metrics like VO2 max and perceived exertion, the log assists in workout optimization and cardiovascular health management. Whether utilizing wearable tech or manual pulse monitoring, tracking these variables ensures precise target heart rate alignment. This data-driven approach enhances metabolic efficiency, promotes active recovery, and prevents overtraining. By documenting intensity fluctuations, athletes can refine endurance strategies and achieve peak metabolic demand during every training session.
Basal Metabolic Rate (BMR) Adjustment Worksheet
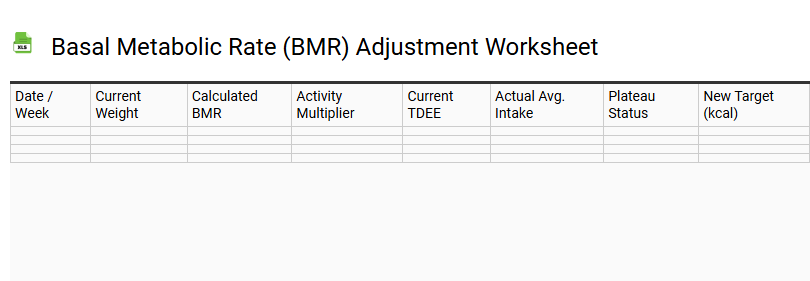
💾 Basal Metabolic Rate (BMR) Adjustment Worksheet .xls
A Basal Metabolic Rate (BMR) Adjustment Worksheet serves as a critical tool for calculating your resting energy expenditure. By utilizing validated formulas like the Mifflin-St Jeor equation, this template helps determine the minimum calories required for basic physiological functions at rest. To achieve precise weight management goals, users must apply a specific activity multiplier to derive their Total Daily Energy Expenditure (TDEE).
Effective tracking involves adjusting variables such as:
- Body composition and lean muscle mass ratios.
- Specific physical activity levels (PAL).
- Metabolic adaptations required for a calorie deficit or surplus.
This structured approach ensures accurate energy balance monitoring, supporting sustainable metabolic health and optimized macronutrient distribution. Whether aiming for fat loss or muscle gain, integrating thermogenesis factors into your daily caloric intake is essential for long-term fitness success.
Food Quality and Inflammation Scorecard
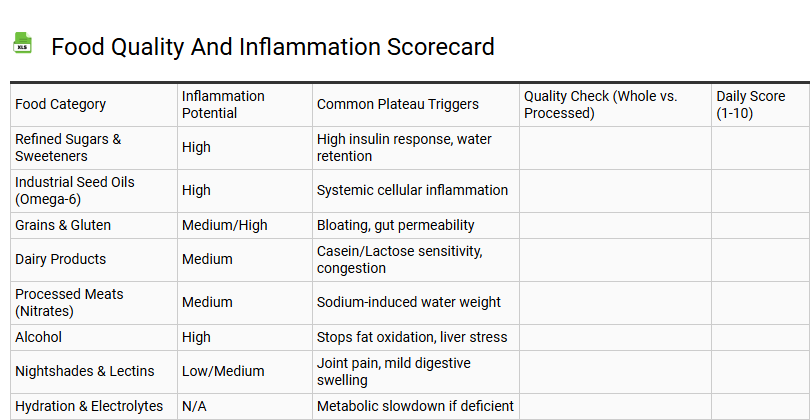
💾 Food Quality and Inflammation Scorecard .xls
This evaluation tool analyzes the direct relationship between dietary intake and physiological responses. By categorizing ingredients based on their biological impact, the scorecard provides a measurable assessment of nutritional choices. It identifies the balance between pro-inflammatory triggers, such as refined sugars or trans fats, and protective elements like antioxidants and omega-3 fatty acids.
- Nutrient Density: Measures the concentration of vitamins and minerals relative to caloric content.
- Processing Level: Evaluates the presence of synthetic additives and metabolic disruptors.
- Bioavailability: Assesses how efficiently the body absorbs and utilizes essential compounds.
Utilizing this framework allows individuals to refine their eating habits, prioritizing whole foods that support cellular recovery and immune function. The objective is to foster an internal environment that reduces chronic systemic stress while enhancing overall vitality and metabolic health through informed, data-driven food selections.
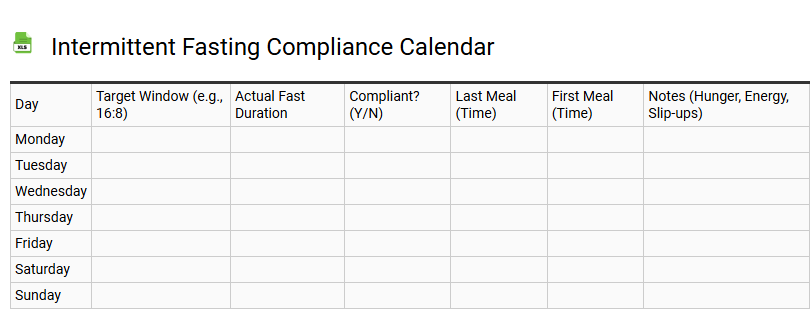
Intermittent Fasting Compliance Calendar
💾 Intermittent Fasting Compliance Calendar .xls
An Intermittent Fasting Compliance Calendar serves as a dedicated tool for monitoring daily adherence to specific eating windows. By documenting every successful fasting period, individuals can visualize their consistency and identify behavioral patterns that influence their progress.
Utilizing this structured template helps maintain momentum through several key functions:
- Accountability: Marking each completed fast creates a sense of accomplishment and reinforces the commitment to a chosen protocol.
- Trend Analysis: Observing streaks allows for the identification of specific days or environments where maintaining the fast becomes more challenging.
- Goal Alignment: Transforming abstract health objectives into a tangible daily record fosters the discipline necessary for long-term metabolic benefits.
Consistent documentation turns periodic efforts into a sustainable lifestyle, ensuring that every fasting window and eating period aligns with broader wellness aspirations.
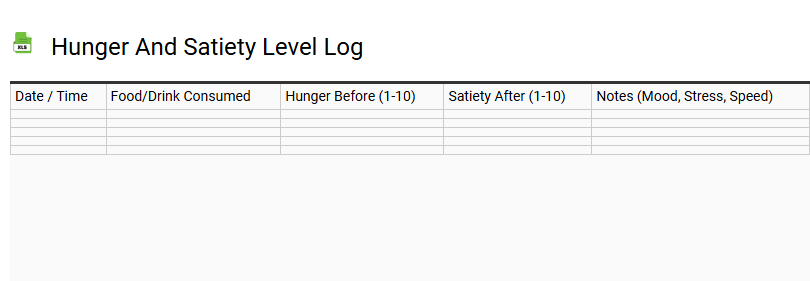
Hunger and Satiety Level Log
💾 Hunger and Satiety Level Log .xls
A hunger and satiety level log serves as a fundamental tool for mastering mindful eating and intuitive eating. By utilizing a standardized hunger scale, individuals can monitor internal fullness cues and improve appetite regulation. This structured approach to tracking dietary habits helps distinguish between physiological needs and emotional eating triggers.
Implementing this template encourages greater nutritional awareness and metabolic health by providing immediate biofeedback on energy levels. Key benefits include:
- Enhanced recognition of satiety signals for better portion control.
- Identification of patterns related to blood sugar stability and energy crashes.
- Improved digestive wellness through conscious consumption.
Consistently using a log empowers users to reconnect with their body's natural homeostatic signals, fostering a sustainable relationship with food intake and supporting long-term weight management goals without restrictive dieting.
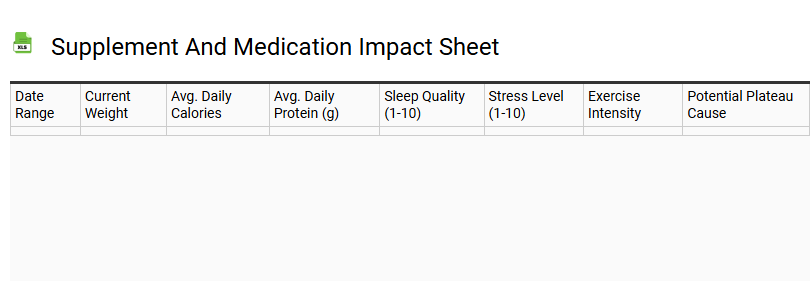
Supplement and Medication Impact Sheet
💾 Supplement and Medication Impact Sheet .xls
A Supplement and Medication Impact Sheet serves as a vital clinical tool for monitoring the physiological response to various substances. This comprehensive documentation tracks the synergy between prescription drugs and dietary supplements, identifying potential drug-nutrient interactions that could compromise health outcomes. By utilizing this structured template, patients can meticulously record dosage timing, frequency, and observed side effects, facilitating clearer communication with their healthcare provider.
Monitoring therapeutic effects and contraindications ensures that your wellness routine remains safe and biologically compatible. Chronicling these variables aids in identifying how specific compounds influence nutrient absorption and critical biological markers. This systematic approach to pharmacological tracking enhances patient adherence and optimizes the integration of alternative therapies with standard medical protocols, ultimately refining your long-term health strategy through data-driven insights and detailed medical history maintenance.
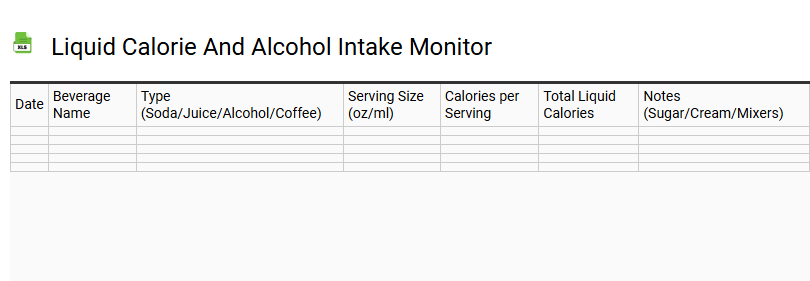
Liquid Calorie and Alcohol Intake Monitor
💾 Liquid Calorie and Alcohol Intake Monitor .xls
This liquid calorie and alcohol intake monitor provides a sophisticated framework for tracking beverage nutrition and metabolic health. By logging ethanol content, sugar-sweetened beverages, and hydration levels, users can effectively mitigate unintended caloric surplus. Utilizing this drink diary allows for the precise analysis of macronutrient profiles and standard drink units, which are critical for weight management and liver health.
The template facilitates portion control and nutrient density assessment across various potable liquids, including spirits, craft beers, and smoothies. This dietary tracking tool simplifies the monitoring of empty calories and glycemic impact, ensuring a balanced nutritional intake. Through systematic fluid consumption documentation, the monitor supports informed lifestyle adjustments, optimizing biometric data and long-term wellness goals within a streamlined, user-centric digital interface.
Body Measurement and Inch Loss Tracker
💾 Body Measurement and Inch Loss Tracker .xls
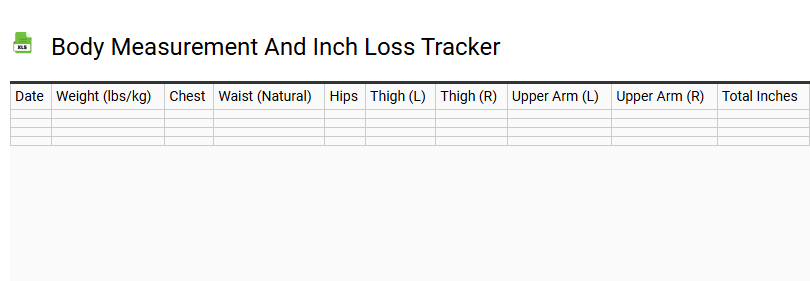
A comprehensive body measurement and inch loss tracker serves as a vital tool for documenting physical transformations that the bathroom scale often overlooks. By recording precise anthropometric data, users can monitor significant fluctuations in chest, waist, hip, and thigh circumferences. This systematic approach to fitness tracking highlights essential changes in body composition, emphasizing muscle gain and subcutaneous fat reduction.
Utilizing a flexible tape measure to log weekly data points helps visualize non-scale victories and calculate critical health metrics like the waist-to-hip ratio. This template is optimized for those seeking a detailed fitness progress log, providing a clear overview of physiological shifts and aesthetic milestones. Whether the goal is weight management or hypertrophy, consistent tracking of body dimensions offers the empirical evidence needed to sustain motivation and refine nutritional strategies throughout any wellness journey.
Consistency and Adherence Heatmap
💾 Consistency and Adherence Heatmap .xls
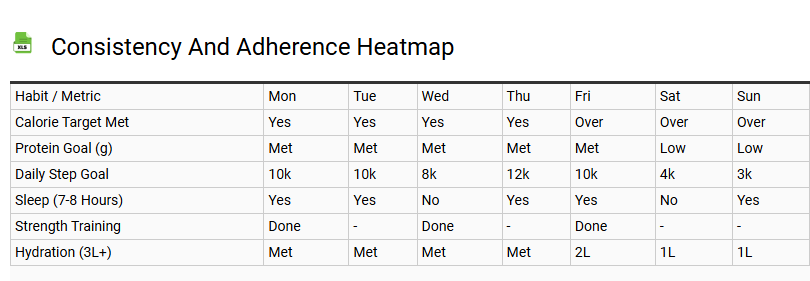
A Consistency and Adherence Heatmap template serves as a robust data visualization tool designed for performance tracking and monitoring behavioral patterns. By leveraging a color-coded grid, this matrix offers a clear chronological overview of compliance monitoring and habit formation. It enables stakeholders to identify fluctuations in operational efficiency and strategic alignment instantaneously. Utilizing such a visual representation simplifies trend analysis, allowing for the evaluation of progress metrics and the maintenance of accountability across diverse workflows. Whether applied to personal habit tracking or corporate quality assurance, the heatmap provides essential qualitative insights into process stability. By mapping adherence levels against time-based variables, organizations foster a culture of reliability and data-driven decision-making, ensuring all activities remain consistent with established benchmarks and long-term key performance indicators.
Metabolic Adaptation Analysis Calculator
💾 Metabolic Adaptation Analysis Calculator .xls
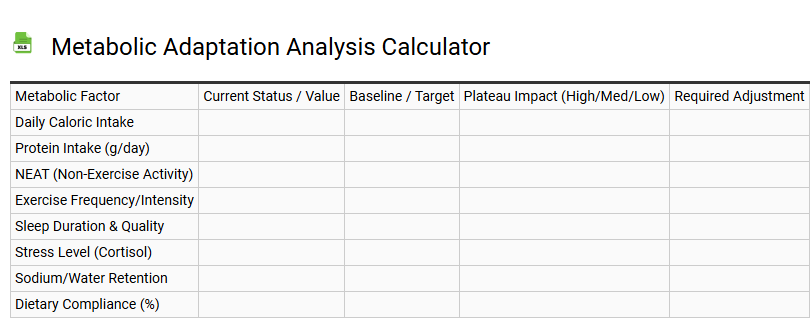
A Metabolic Adaptation Analysis Calculator is a sophisticated tool designed to quantify how the body adjusts its Total Daily Energy Expenditure (TDEE) during prolonged calorie deficits. This physiological process, known as adaptive thermogenesis, often leads to a weight loss plateau as the Basal Metabolic Rate (BMR) and non-exercise activity thermogenesis (NEAT) decrease to conserve energy.
By analyzing the variance between predicted and actual energy expenditure, this template helps users identify metabolic slowing and hormonal downregulation. Utilizing these insights allows for precise adjustments to energy balance and macronutrient intake. Key benefits of this analysis include:
- Identifying the onset of metabolic damage from chronic dieting.
- Calculating the necessary refeed periods to restore metabolic flexibility.
- Optimizing caloric targets to bypass plateaus while maintaining lean muscle mass.
This data-driven approach ensures sustainable fat loss by aligning nutritional strategies with the body's shifting metabolic health.
Refeed and Cheat Meal Impact Log
💾 Refeed and Cheat Meal Impact Log .xls
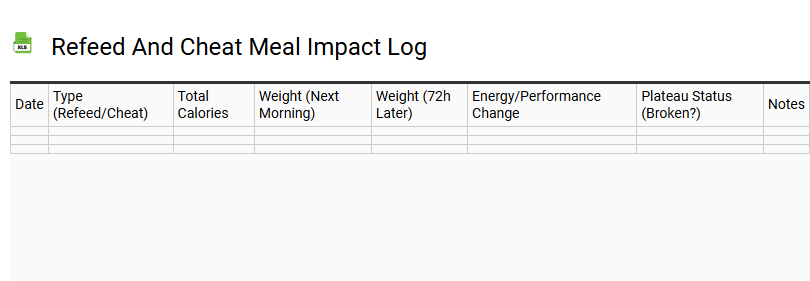
A Refeed and Cheat Meal Impact Log is an essential diagnostic tool for optimizing metabolic health and overcoming a fat loss plateau. By systematically documenting macronutrient intake during a strategic calorie surplus, individuals can monitor how a temporary diet break influences leptin regulation and muscle glycogen stores.
This tracking method evaluates the physiological shift from caloric restriction to refeeding, highlighting correlations between insulin sensitivity and energy expenditure. Users should record scale weight fluctuations, water retention, and satiety levels to differentiate between productive metabolic recovery and digestive distress.
Analyzing these data points helps fine-tune periodized nutrition, ensuring that high-carb interventions enhance workout performance and thermogenesis without stalling long-term body composition goals. This log transforms subjective experiences into actionable data for sustained metabolic flexibility and psychological adherence.
A weight loss plateau analysis sheet is a vital diagnostic tool for identifying a weight loss stall. This structured template helps evaluate key variables including:
- Metabolic adaptation and caloric intake levels.
- Macronutrient tracking for precise nutritional optimization.
- Physical activity trends and body composition changes.
By applying these metabolic adjustments, you can effectively maintain a caloric deficit. Use this data-driven framework to refine your strategy, overcome stagnation, and ensure sustainable progress toward your health goals.